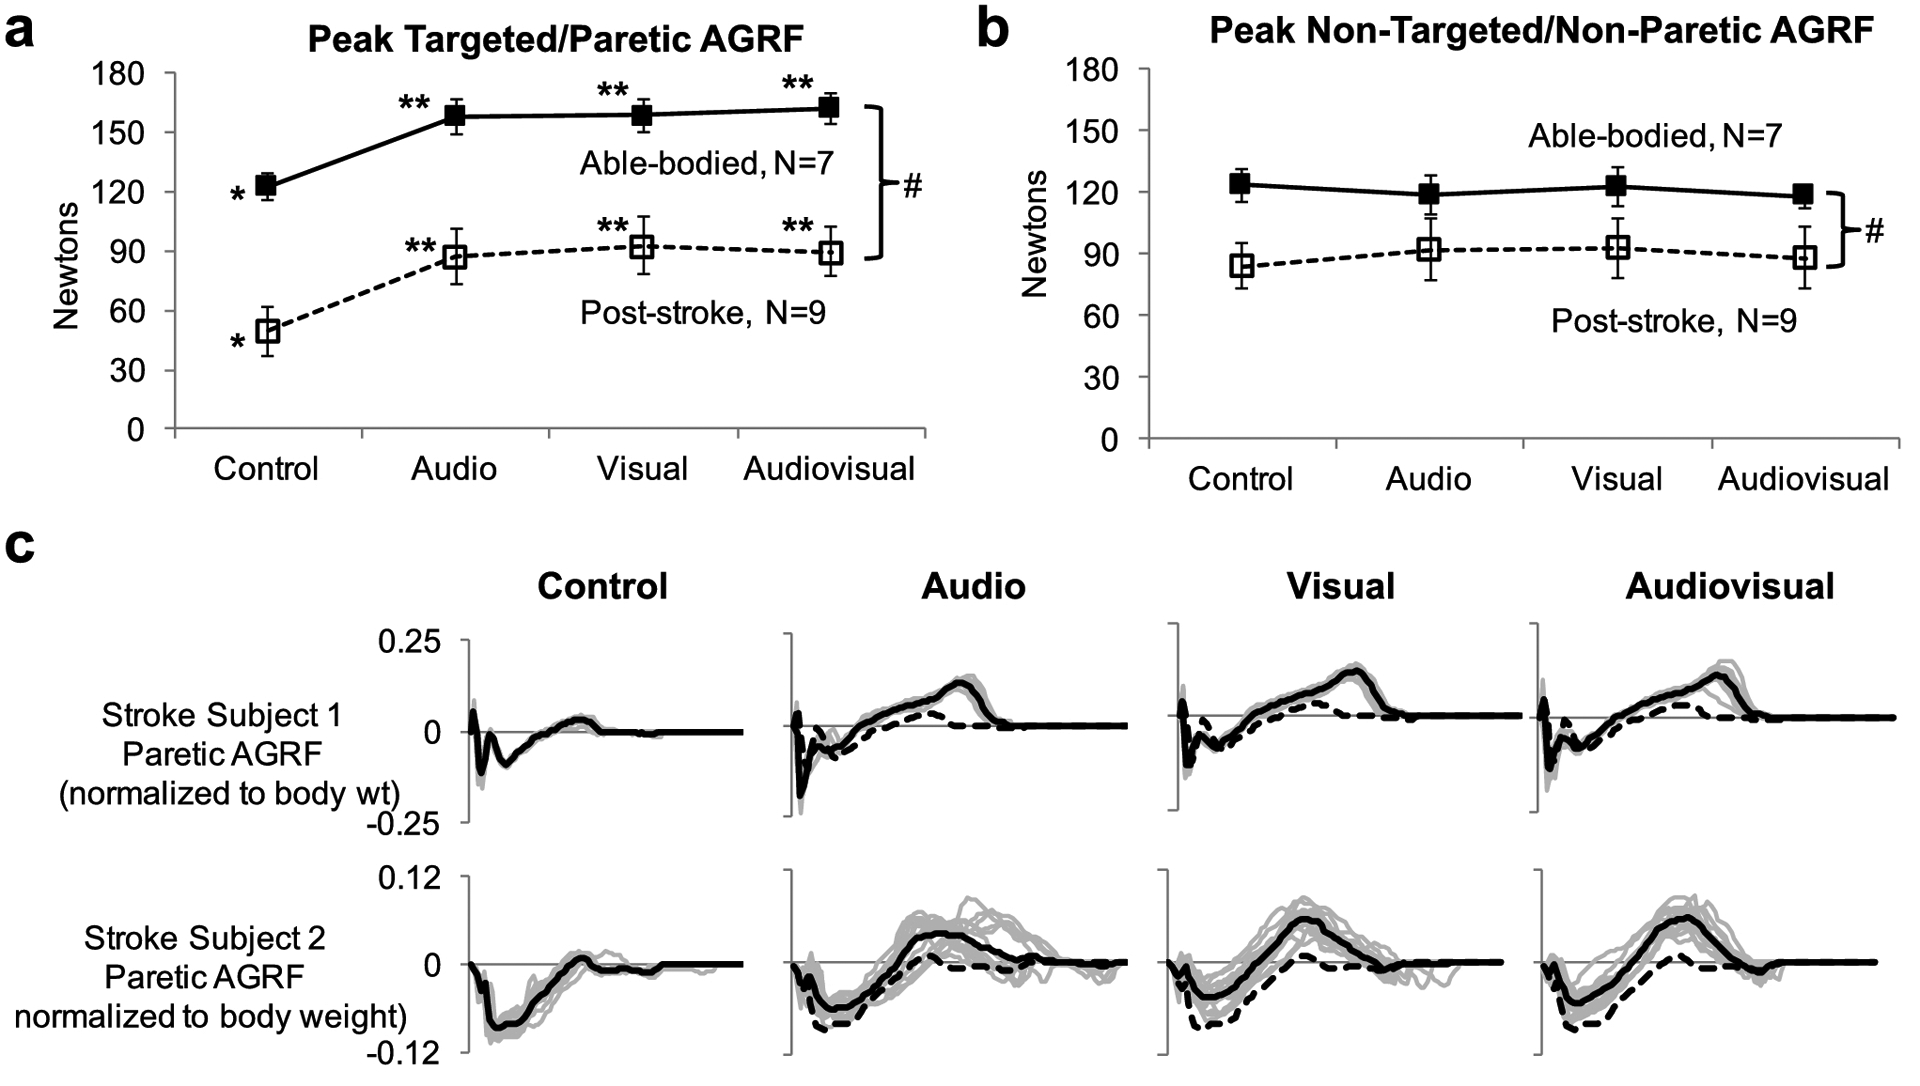
Fig. 2. Peak AGRF of the (a) targeted (right) and paretic leg and (b) non-targeted and non-paretic leg for able-bodied (N=7, filled symbols) and post-stroke (N=9, unfilled symbols) individuals during the control and biofeedback (audio, visual, audiovisual) gait trials.

The 2-way repeated measures ANOVA detected a significant main effect of group (p<0.001, # symbol). The symbol * indicates a significant main effect (p<0.05) of biofeedback mode detected by the 1-way repeated measures ANOVA. The symbol ** indicates a significant difference (p<0.05) compared to the control trial, detected by Bonferroni-corrected post-hoc paired comparisons. Error bars represent standard error. (c) Raw antero-posterior GRF data during the control and biofeedback trials are shown for two representative stroke individuals. Solid black lines indicate the GRF profiles throughout the gait cycle (x-axis is normalized to the gait cycle) averaged over multiple strides during the trial. Light grey lines indicate GRFs for individual gait cycles. The dotted black line in the biofeedback trials (audio, visual, audiovisual) displays the average AGRF during the control trial (for comparison). Note that both representative stroke individuals significantly increased peak AGRF during each of the three biofeedback gait trials compared to the control trial
