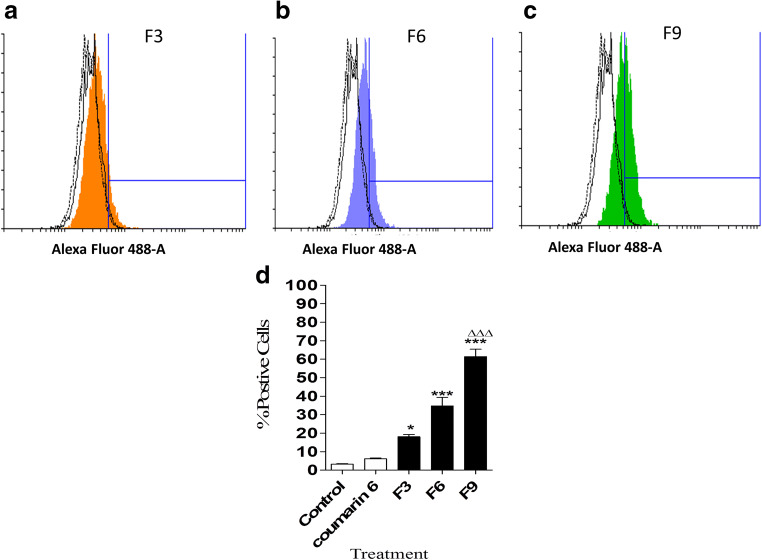
Fig. 4.
Quantitative cellular uptake of different types of SL-loaded NC after 24 h, as determined by flow cytometry. Individual histograms representing fluorescence shift resulted after treatment with F3 (a), F6 (b) and F9 (c). Direct comparison of percentage of positive cells showing cellular uptake of each NC (d). Values are mean ± SD with n = 3. For 4d ***p < 0.001 compared with control and coumarin 6 groups. ΔΔΔp < 0.001 compared with F3 and F6

