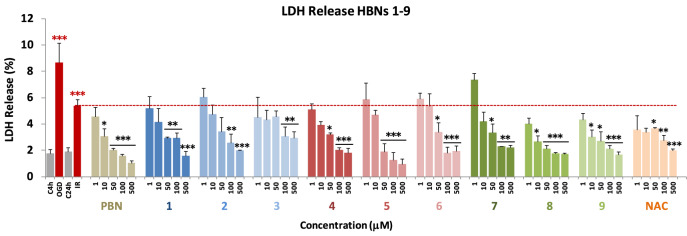
Figure 4.
Effect of HBNs 1–9 on the LDH release in SH-SY5Y cells after IR. Bars show % LDH release after OGD (4 h) and IR (24 h), without treatment (IR 24 h) or treated with HBNs1–9, PBN and NAC, at the indicated concentrations. Values are the mean ± SEM of three experiments, each one performed in triplicate, and compare the effect of OGD and IR on respective controls, C4h and C24h, respectively (red ***) or the effect of the different compounds after IR (24 h) with IR (24 h) in the absence of these compounds (black ***). Data were statistically analyzed by one-way ANOVA, followed by Holm-Sidak as test post hoc. *P < 0.05; **P < 0.01; and ***P < 0.001.

