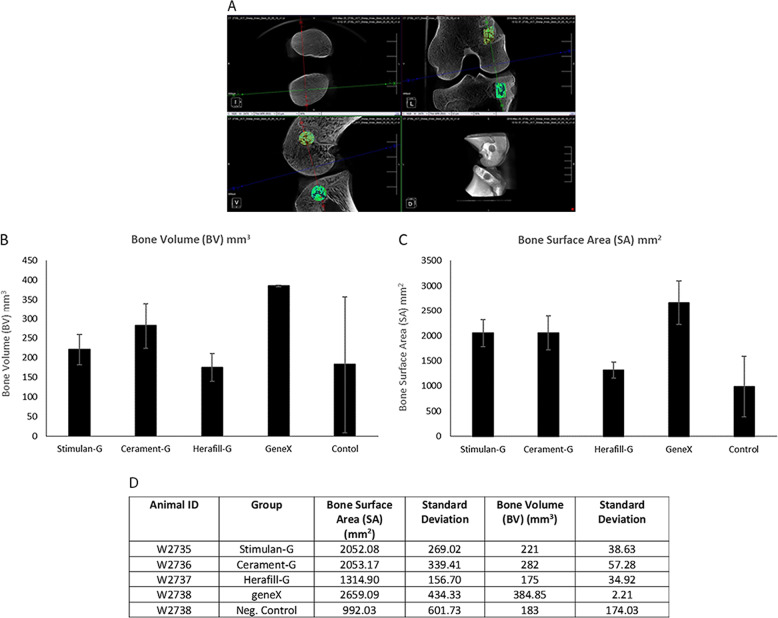
Fig. 4.
a–d Mean Bone Volume (BV) and Surface Area (SA) for each group (mean ± standard deviation). One hundred and twenty-five consecutive slices, in the centre of the defect were selected and assigned to a Region of Interest (ROI) shown in green. Representative image can be seen in a. Once the ROI was defined, the threshold values were adjusted to isolate the newly formed bone from bone marrow. The ROI was used to determine the bone volume (BV) and surface area (SA) of new bone. Bone Volume (b) and Surface Areas (c) were quantified using an IRW analysis tool by selecting a region for each implant under a constant threshold value. geneX and control samples (n = 2). Descriptive statistics (d) showing results (mean and standard deviations) of µCT analysis for Bone Surface Area and Bone Volume for each defect at the 12-week time point. Error bars show standard deviation

