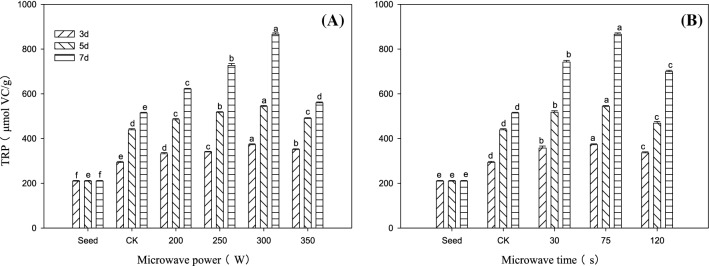
Fig. 2.
Changes in the TRP of Tartary buckwheat sprouts in response to different microwave treatments. A: microwave time (75 s); B: microwave power (300 W). Values of the TRP with different microwave treatment levels shown with different lowercase letters are significantly different by ANOVA with Duncan' s multiple range test at P < 0.05

