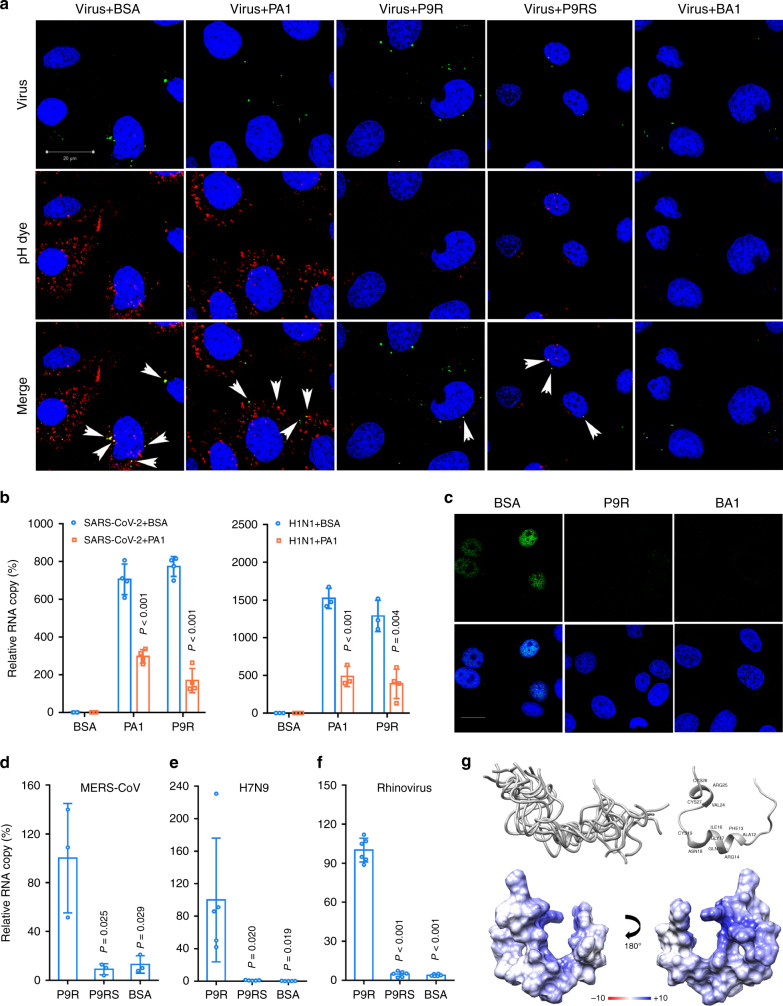
Fig. 3. P9R could inhibit virus–host endosome acidification through directly binding to viruses.
a Fluorescence labeled virus (green) was pretreated with indicated peptides (25 μg ml−1) or bafilomycin A1 (BA1). MDCK cells were infected with the treated H1N1-virus and low pH sensitive dye (red) was added to cells. Live cell images were taken by confocal microscope (scale bar = 20 μm). Experiments were repeated with three biological samples. Red dot indicated the endosomal acidification. Nuclei was stained as blue. White arrows indicated the colocalization of virus and endosomal acidification. b P9R binding to SARS-CoV-2 (n = 4) and A(H1N1)pdm09 (n = 3) could be reduced by PA1. Virus was pretreated by PA1 or BSA, and then the treated virus binding to the indicated peptides were measured by RT-qPCR. P values were calculated by the two-tailed Student’s t test when compared with virus treated by BSA. c P9R could inhibit viral RNP release into nuclei. H1N1 virus was pretreated by BSA, P9R or bafilomycin A1 (BA1), and then MDCK cells were infected with the treated virus. Images of viral NP (green) and cell nuclei (blue) were taken at 3.5 h post infection. Scale bar = 20 μm. Experiments were repeated with three biological samples. d–f P9R could broadly bind to MERS-CoV (n = 3), H7N9 virus (n = 5), and rhinovirus (n = 6). The relative RNA copy of virus binding to peptides was normalized to the virus binding to P9R. P values were calculated by the two-tailed Student’s t test when compared with P9R. Data are presented as mean ± SD from at least three independent experiments. g Top left: top 10 water-refined structures of P9R generated by ARIA displayed as backbone traces, showing an overall flexible structure. Top right: representative NMR structure of P9R displayed as ribbon plot showing the formation of some helix patches. Bottom: surface charge plot of the representative NMR structure of above P9R showing largely positively charged peptide surface. Source data are provided as a Source data file.

