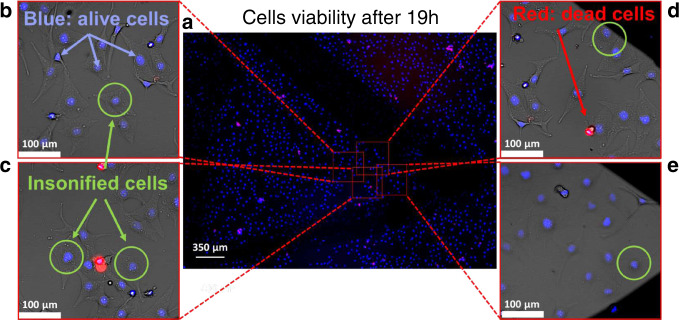
Fig. 4. Cells’ viability monitoring.
a Overview of the central part of the microfluidic device in which the viability experiments were performed. The cells are stained using a viability kit and imaged at 360 and 535 nm excitation (460 and 617 nm emission). The cell nucleus are represented in blue, while the dead cells appear in red. The whole field of view contains 4581 cells (226 dead—5%) while the region where manipulation took place contains 166 cells (5 dead—3%). b–e Details of the five cells exposed to the acoustical tweezers for 2 min (four others were exposed on another similar device). The green circle represents the first ring of the trap. Long-term viability tests were performed overall on nine insonified cells in two different microfluidic chambers.

