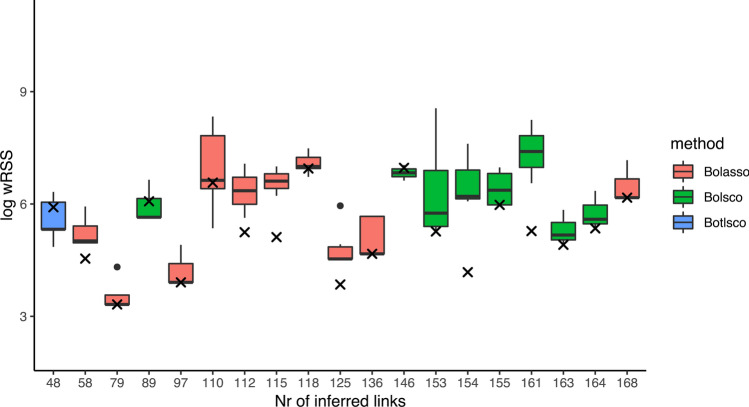
Figure 3.
Validation of the inferred GRNs’ fit to the measured data. Each x-axis tick mark shows the prediction performance in terms of the wRSS of an inferred GRN topology fit to training data under cross-validation, compared to its ability to fit shuffled data. X marks represent the inferred GRNs. The filled color box displays the median and interquartile range, and whiskers bound points maximally extending 1.5 times this range. Beyond this, outlier points are shown.

