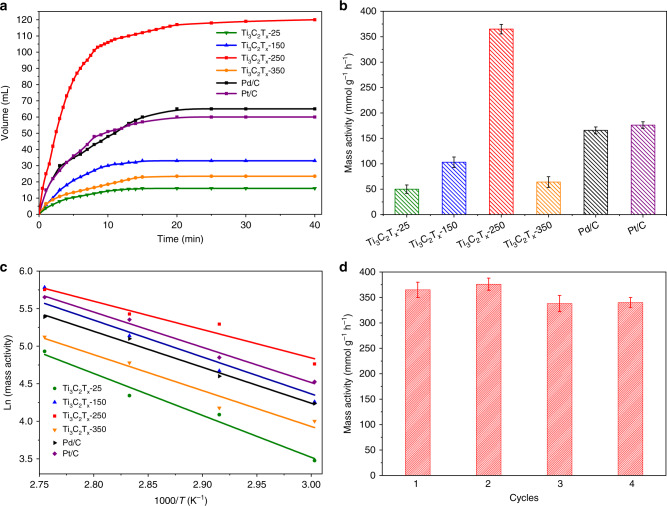
Fig. 3. Catalytic performance of different catalysts in the dehydrogenation of HCOOH.
a Plots of the volume of gas formed from HCOOH decomposition over different catalysts versus time at 80 °C. b Comparison of mass activities for different catalysts. c Arrhenius plot for the dehydrogenation of HCOOH over different catalysts. d Catalytic performance of Ti3C2Tx-250 after successive rounds of reaction. The error bar was drawn based on the calculated standard error of three parallel tests.

