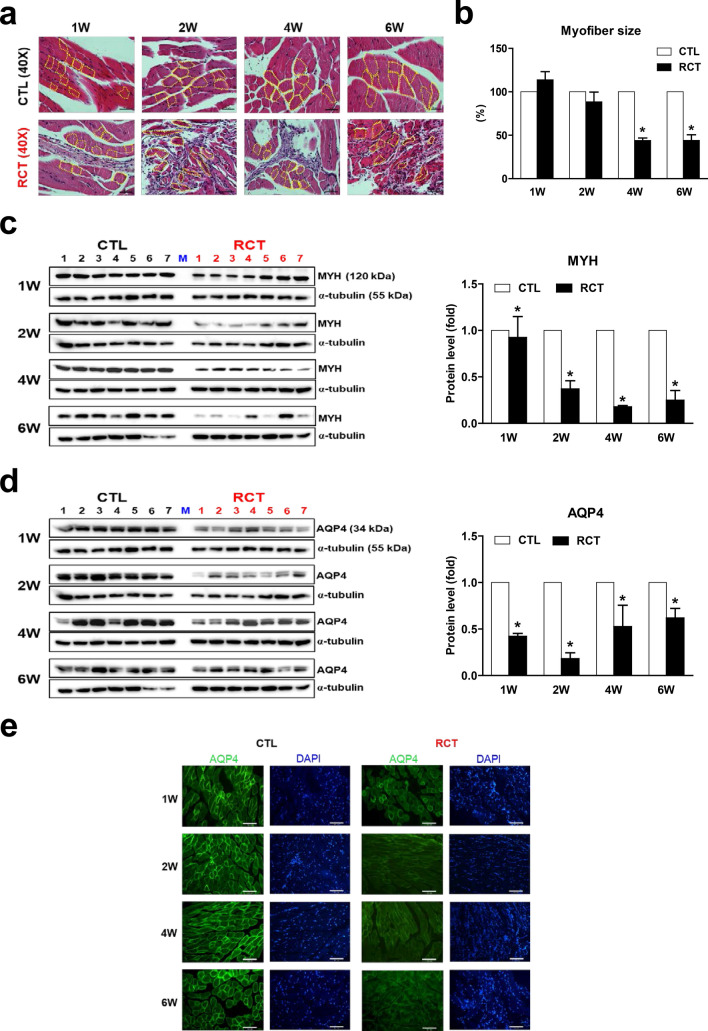
Figure 2.
Reduced aquaporin 4 (AQP4) protein levels in atrophied muscle following rotator cuff tear (RCT). (a) Reduced myofiber size in muscle injured by RCT. Magnified view of the H&E-stained muscle. Magnification, × 400. Scale bar, 50 μm. The yellow dotted line indicates the muscle myofiber. (b) Myofiber size in control (CTL) and RCT muscles. The size of each dotted area was measured using ImageJ software. *P < 0.05. (c) Western blot analyses for myosin heavy chain (MYH) protein expression between control and the injured muscle after RCT (n = 7 per group). Densitometric analyses of the western blots are shown in the graphs. Data represents mean ± SEM. *p < 0.05. (d) Reduced aquaporin 4 (AQP4) protein levels in atrophied muscle following RCT (n = 7 per group). Densitometric analyses of the western blots are shown on the right. Data represent means ± standard errors of the means. *P < 0.05. (e) Immunofluorescence microscopy analyses of muscle cells isolated at different stages after RCT (n = 3 per group). The green signal in each panel represents membranous AQP4 protein and the blue signal represents cell nuclei. Magnification, × 200. Scale bar, 100 μm.

