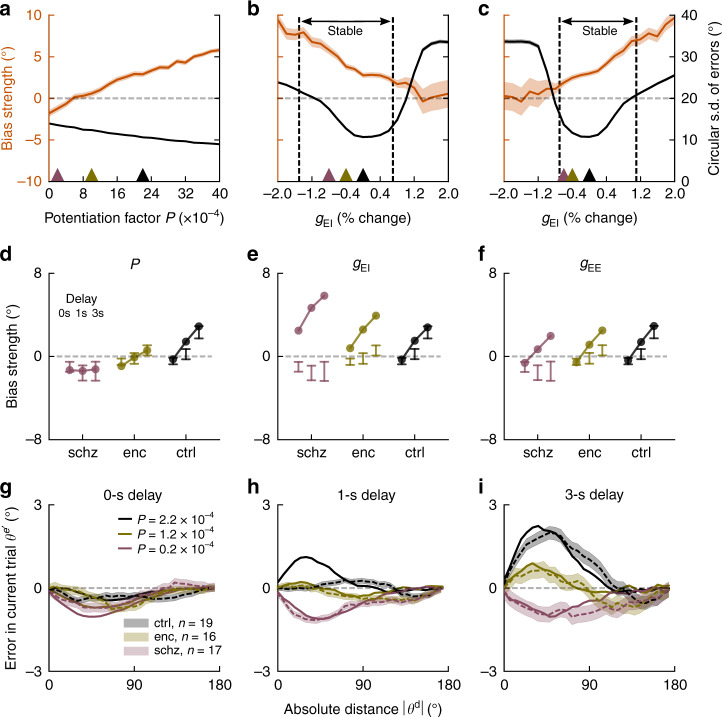
Fig. 3. Altered STP simulates reduced serial dependence in spiking neural networks.
a–c Serial dependence (orange, bias coefficients from linear model, “Methods”) and precision (black, circular s.d. of errors) as a function of model parameters in 3 s delay trials (20,000 trials per parameter value). Vertical dashed lines indicate transition to unstable network regimes for which more than 10% of trials were outliers ( > 57.3°, i.e., 1 radian). Shading, 95% C.I. for regression estimates of bias coefficients in simulated responses. a Serial dependence decreased gradually when decreasing STP (potentiation factor P), while the network remained stable for all simulated values of P. Precision changed slightly as a function of STP. b Cortical disinhibition via decreased gEI augmented serial bias while strongly affecting precision and stability, either due to instability of persistent activity (right, Supplementary Fig. 14b), or due to instability of spontaneous activity (left, Supplementary Fig. 14a). c Lowering recurrent cortical excitation (gEE) led to the opposite pattern, decreasing biases. d–f Delay dependence of biases for each group, as defined by parameter values in (a–c), (respectively colored triangles). Points depict mean bias strength (over 20,000 trials) for each parameter value. For comparison, error bars indicate 95% CI for bias strength obtained from n = 19 healthy controls (ctrl), n = 17 patients with schizophrenia (schz), and n = 16 patients with anti-NMDAR encephalitis (enc) (reordered from Fig. 1g–i). d Lowering STP strength reproduced the experimental data. In e, f reduction of NMDAR conductances (gEI or gEE) did not reproduce group and delay dependencies of experimental biases. g–i Solid lines, simulated serial dependence by delay length for different values of P, indicated by colored triangles in (a) (20,000 trials per potentiation level P). Dashed lines with error bars, serial dependence in encephalitis, schizophrenia, and healthy controls. Bias calculated as averaged ‘folded’ error for binned absolute previous-current distances θd. Shading, ±s.e.m. Compare to Supplementary Fig. 15 for a network with STP (and STP disruptions in patients) in both E–E and E–I connections.

