Figure 3.
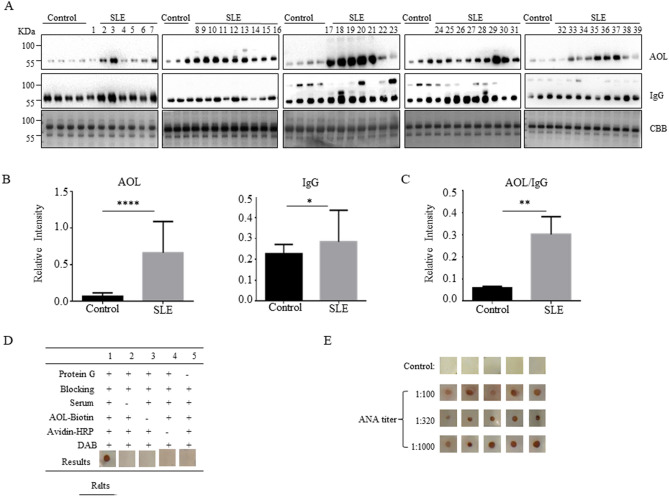
Core fucosylation was significantly increased in the SLE patients. (A) The sera of SLE patients were analyzed by AOL blot and Western blot. Plates were incubated with biotin-conjugated AOL (1:15,000) or donkey anti human IgG (1:5,000), and CBB. Data were obtained in three independent experiments. (B) Densitometric analysis of the bands of IgG and AOL in SLE sera. The core fucosylation levels between SLE serum and health control serum were compared. Data are shown as mean values ± SEM (****p < 0.0001; ***p < 0.001). (C) The value of AOL/IgG in SLE. Data are shown as mean values ± SEM (**p < 0.01). (D) Dot-ELISA assay. 2 μg protein G was spotted onto each membrane, and the membranes were incubated successively with serum (1:100), biotin-conjugated AOL (1:1,000) and HRP-conjugated streptavidin (1:3,000). 1, positive control serum; 2, negative control without serum only; 3, negative control without biotin-conjugated AOL only; 4, negative control without HRP-conjugated streptavidin only; 5, negative control without protein G immobilized. (E) SLE sera were detected by Dot-ELISA assay. SLE sera were separated with different ANA titers, 1:100, 1:320, 1:1,000 (n = 5). Each dot represents one single of patients who were previously tested with different titers of ANA.

