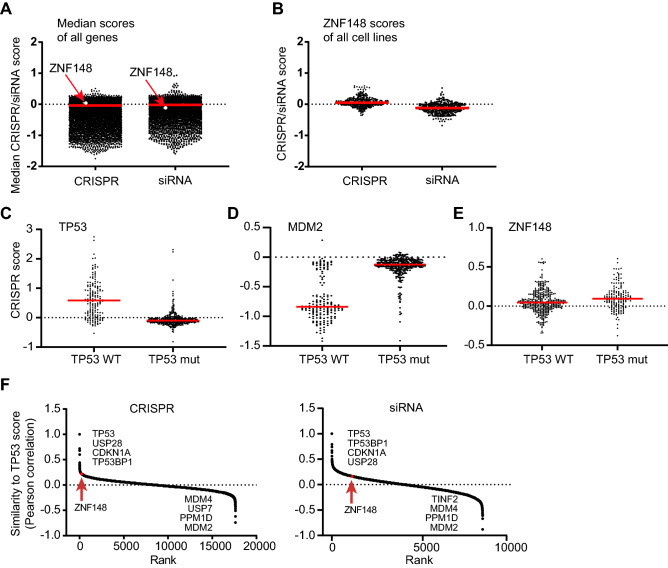
Figure 4.
No genetic interaction between ZNF148 and TP53 in human cancer cell lines. (A) Graph showing the median CRISPR and siRNA scores across the human cancer cell lines for all genes. ZNF148 scores are indicated by arrows. n = 17,631 (CRISPR) and 16,725 (siRNA) genes, respectively. (B) Graph showing the CRISPR and siRNA scores of ZNF148 for all cancer cell lines. n = 432 (CRISPR) and 328 (siRNA) cell lines, respectively. (C–E) Graphs showing the CRISPR scores of TP53 (C) or MDM2 (D) or ZNF148 (E) for cell lines with wild-type (left, n = 354) or mutated (right, n = 164) TP53. (F) Graphs showing Pearson correlation with CRISPR (left) or siRNA (right) scores of TP53 (y-axis) for all genes sorted by rank (x-axis). The position of ZNF148 is indicated by arrows. n = 17,631 (CRISPR) and 8,296 (siRNA) genes, respectively.

