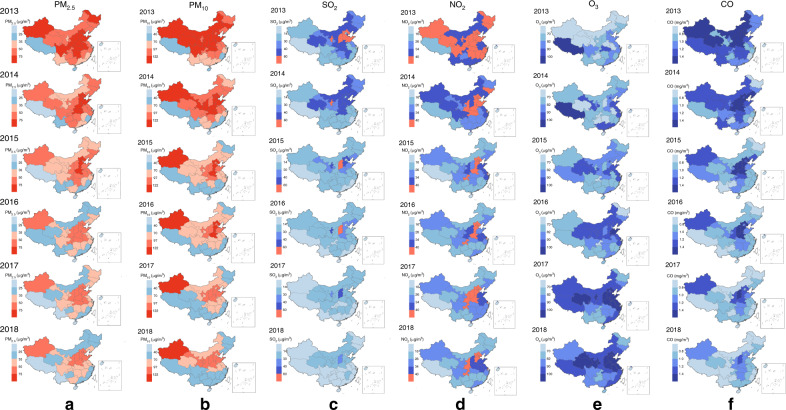
Fig. 3. Changes of spatiotemporal distribution of six air pollutants in China, 2013–2018.
a The changes of average annual value of particulate matter of <2.5 μm (PM2.5) during 2013–2018 in 31 provinces of China. b The changes of average annual value of particulate matter of <10 μm (PM10) during 2013–2018 in 31 provinces of China. c The changes of average annual value of sulfur dioxide (SO2) during 2013–2018 in 31 provinces of China. d The changes of average annual value of nitrogen dioxide (NO2) during 2013–2018 in 31 provinces of China. e The changes of average annual value of ozone (O3) during 2013–2018 in 31 provinces of China. f The changes of average annual value of carbon monoxide (CO) during 2013–2018 in 31 provinces of China. Choropleth maps of average annual value of air pollutants by region. Red means over China guidelines II (issued 2018); Blue: means below China guidelines II. Depth of color denotes air pollutants concentration. Source data are provided as a Source Data file deposited on a publicly available website (10.6084/m9.figshare.12237596.v2).

