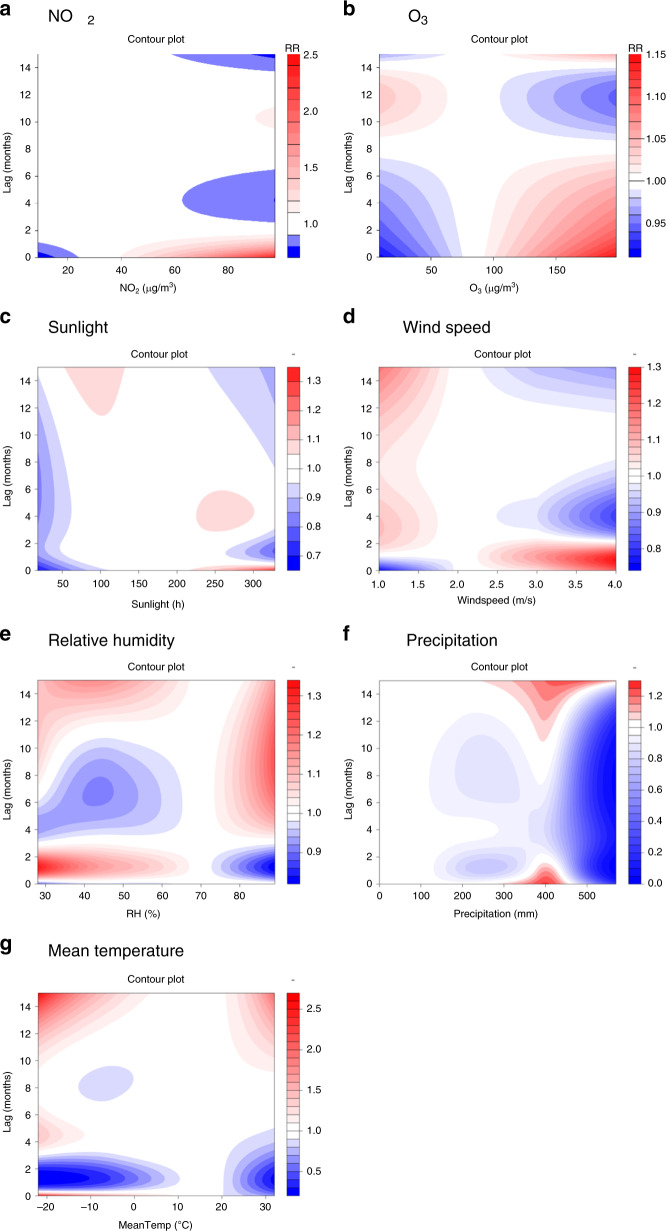
Fig. 6. Contour plots of the exposure–response relationship for the association between scarlet fever incidence and air pollutants or meteorological conditions in the multiple-variable model from 2013 to 2018.
In addition to the adjusted air pollutants and meteorological conditions, the other adjusted variables in the model are temporal trend, the indicator variable of summer and winter breaks, and quantile groups both for average incidences and for incidence in the previous month. a NO2 b O3 c Sunlight d Wind speed e Relative humidity f Precipitation g Mean temperature. The reference level is set as the median value of the corresponding variable. The Y-axis is the lag month ranging from 0 to 15. The X-axis is the range of the observed values of each variable. The color gradient represents the relative risk (RR). The red color gradient represents higher strength of RR, above 1, and the blue gradient represents lower strength of RR, below 1. The white color represents no difference, at RR = 1. Source data are provided as a Source Data file.

