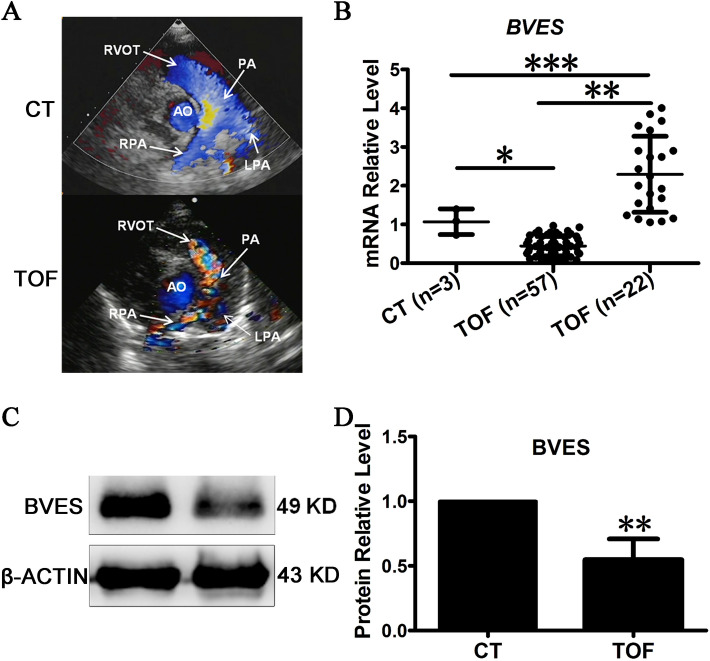
Figure 1.
Relationship between the expression pattern of BVES and TOF. (A) The phenotype of RVOT stenosis in TOF diagnosed by echocardiography. RVOT, right ventricular outflow tract; AO, aorta; PA, pulmonary artery; RPA, right pulmonary artery; LPA, left pulmonary artery. CT, Control, the normal phenotype; TOF, tetralogy of fallot, the mal-phenotype of TOF patients. (B) qRT-PCR detected the expression of BVES. (C) Western blot detected the expression of BVES in downregulated samples. (D) Quantification of BVES by greyscale analysis. CT, control, RVOT tissue of normal controls; TOF, tetralogy of fallot, hypertrophic RVOT tissue of patients; n: number of samples. *p < 0.05; **p < 0.01; ***p < 0.001. The error bar shows the mean and SD.

