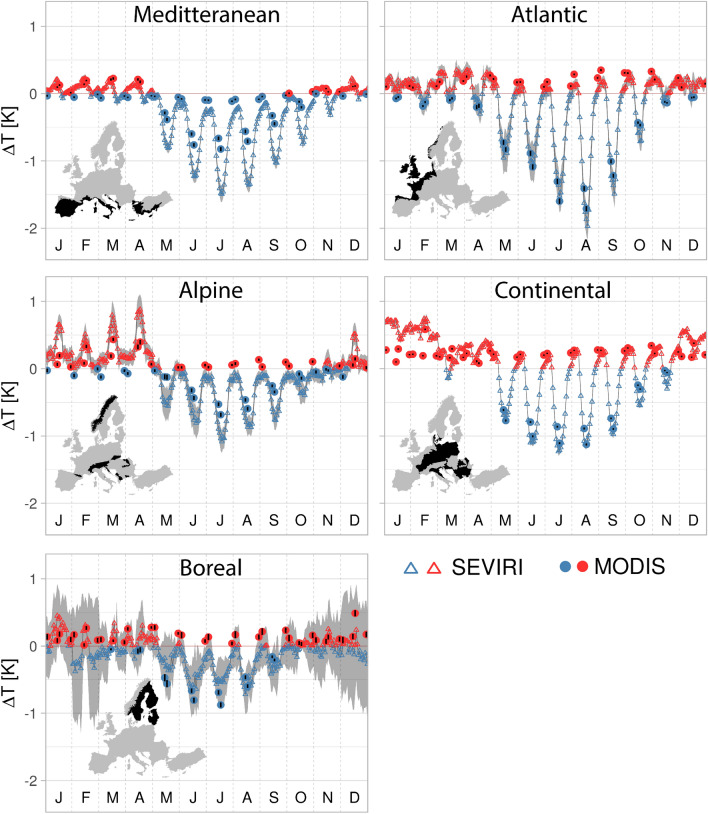
Figure 1.
Pronounced mean diurnal and seasonal cycles of temperature changes caused by an increase in BTF reveal a cooling effect in summer. For every month denoted as J (January), … , D (December) on the x-axis the mean diurnal cycle of the LST change induced by an 80% increase of the broad-leaved tree fraction is shown. For SEVIRI hourly mean values are available (i.e. 24 values for each month). For MODIS, observations are available at four different time steps per day which are approximately: 01:30, 10:30, 13:30 and 22:30. Confidence intervals for SEVIRI are shown in grey. Confidence intervals for the MODIS observations are denoted as black lines through the colored dots.

