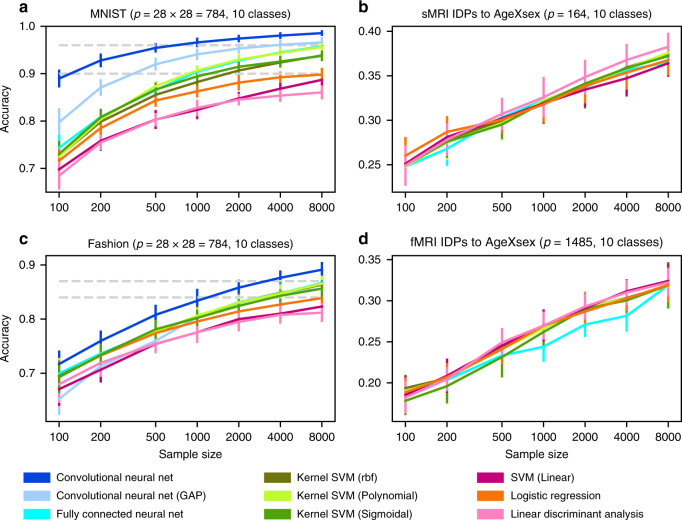
Fig. 2. Classification performance gains with more powerful algorithms in two machine learning datasets.
Shows performance scaling of prediction accuracy (y axis) as a function of increasing sample size (x axis) for generic linear models (red tones), kernel models (green tones), and deep neural network models (blue tones). All model performances are evaluated on the same independent test set. a In handwritten digit classification on the MNIST dataset, the classes of three linear, three kernel, and three deep models show distinct scaling behavior: linear models are outperformed by kernel models, which are, in turn, outperformed by deep models. The prediction accuracies of most models start to exhibit saturation at high sample sizes, with convolutional neural network models approaching near perfect classification of ten digits. c As a more difficult successor of MNIST, the Fashion dataset is about classifying ten categories of clothing in photos. Similar to MNIST, linear models are outperformed by kernel models, which are outperformed by deep models. In contrast to MNIST, the performances of the model classes are harder to distinguish for low sample sizes and begin to fan out with growing sample size. In the Fashion dataset, more images are necessary for kernel and deep models to effectively exploit nonlinear structure to supersede linear models. b, d Image-derived brain phenotypes (IDPs) provided by the UKBiobank were used to classify subjects into ten subject groups divided by sex and age. The number of categories is equivalent to and the feature number p is similar to MNIST and Fashion. In both commonly acquired structural (sMRI) and functional (fMRI) brain images, linear, kernel, and deep models are virtually indistinguishable across all examined training image sets and prediction accuracies do not visibly saturate. Moreover, using different tree-based high-capacity classifiers did not outperform our linear models as well (Supplementary Fig. 1). To the extent that complex nonlinear structure exists in these types of brain images, our results suggest that this information cannot be directly exploited based on available sample sizes. The number of input variables in a modeling scenario is denoted by p. IDP = image-derived phenotype. Error bars = mean ± SD across 20 cross-validation iterations (all panels).

