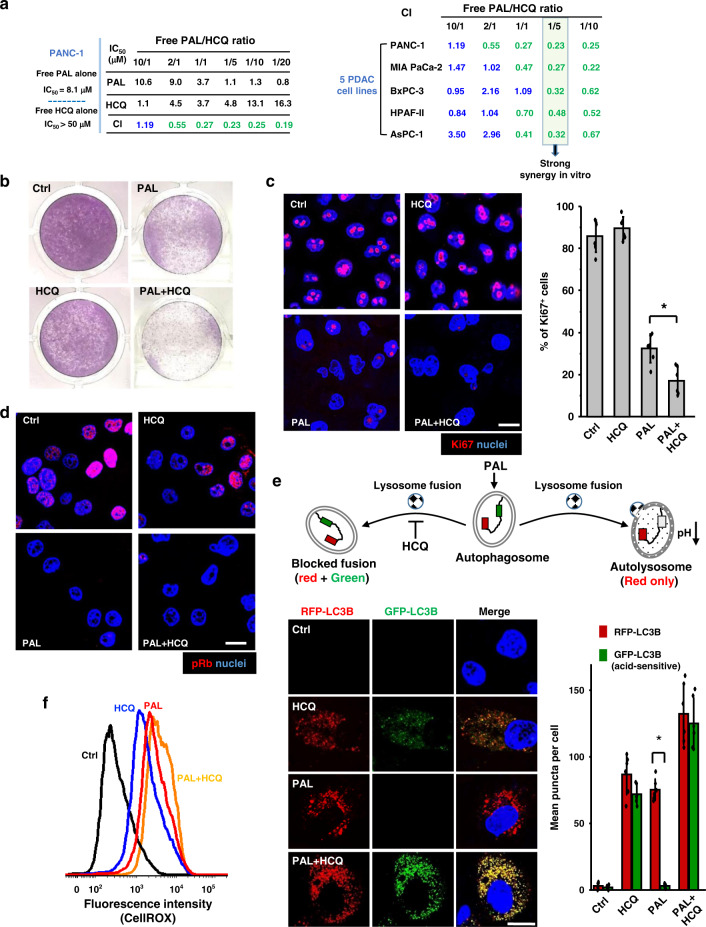
Fig. 1. PAL/HCQ free drug combination led to synergized anti-proliferative effect in PDAC cell lines.
a BrdU proliferation assay was performed on PDAC cells treated by free PAL/HCQ mixtures at various combination molar ratios. Treatment of each concentration was tested in triplicate by a 96-well BrdU proliferation assay (n = 3). Combination index (CI) were calculated for each combination ratio via the CompuSyn software. CI < 1 indicated a synergistic effect and CI ≤ 0.5 indicated a strong level of synergy. The detailed in vitro screening data in five cell lines are provided online (Supplementary Fig. 2). PANC-1 cells were incubated with PAL/HCQ combination or single drug at equivalent concentration (PAL/HCQ = 1:5, PAL = 2.5 μM, HCQ = 12.5 μM) for 72 h and subjected to the following assays to elaborate the associated biological events. b Crystal violet staining of PANC-1 cells visualized the synergistic anti-proliferative effect by PAL/HCQ pair. c Immunofluorescence staining of Ki67 proliferative marker (red), followed by quantification of Ki67+cells in six randomly selected ROIs (n = 6). Free PAL/HCQ combination displayed significantly enhanced anti-proliferative effect compared to PAL mono-treatment (p = 0.0027). Scale bar: 20 μm. d Immunofluorescence staining of phospho-Rb (pRb) suggested that PAL/HCQ combination effectively reduced the pRb expression, which was the hallmark for CDK4/6i-mediated growth arrest. The experiment was repeated twice. Scale bar: 20 μm. e GFP-RFP-LC3B dual reporter assay to determine the blockade on autophagosome–lysosome fusion. Six randomly selected ROIs were used in the analysis (n = 6). The abundance of RFP-LC3B puncta was significantly enhanced over GFP puncta in PAL-treated cells (p = 2.45 × 10⁻⁸), demonstrating the accumulation of autolysosomes. HCQ in combination with PAL prevented the autophagosome–lysosome fusion. Scale bar: 20 μm. f The generation of reactive oxygen species (ROS) were stained by CellROX reagent, and the mean intracellular ROS level was analyzed via flow cytometry. Data represent mean ± SD, and the statistical difference was evaluated by one-way ANOVA followed by Tukey’s post hoc test (*p < 0.05). Source data are provided as a Source data file.

