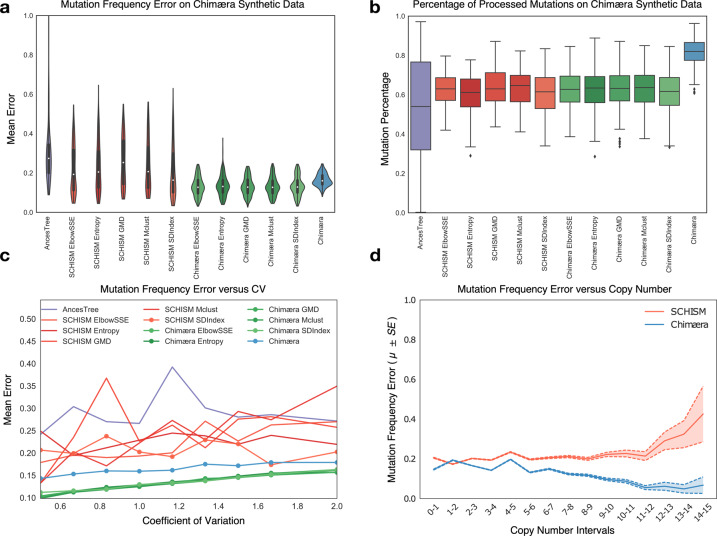
Fig. 3. Performance of mutation frequency estimates on simulated data.
a Performance—measured by mean error across simulated WES datasets from genomes with varying mutation copy numbers—of mutation-frequency estimates by AncesTree (purple), SCHISM (red), and Chimæra (green and blue); SCHISM and Chimæra were evaluated using multiple clustering methods in an effort to improve their accuracy, with SDIndex (SCHISM) and ElbowSSE (Chimæra) producing top accuracy, respectively. In blue, are reported estimates for the published Chimæra, which uses hdbscan. b No method is able to estimate mutation frequencies for every mutation; however, Chimæra assigns frequencies for over 80% of simulated mutations, compared to an average of 60% or fewer for other methods. c Errors in frequency estimates were correlated with genetic instability, which was measured here as the coefficient of variation within copy number distributions used in simulated WES profiles. Inferences by some methods were consistently better than others; e.g., SCHISM with SDIndex clustering outperformed AncesTree inferences. Chimæra clearly outperformed all the other methods regardless of the clustering strategy. d While copy-number variability in the same sample was correlated with inference errors, the absolute magnitude of copy numbers had no significant effect on Chimæra’s performance. We report results for Chimera (hdbscan) and SCHISM with SDIndex (a representative that resembles results with other clustering methods). Standard errors are reported. Mean error is the mean of L1 distances between true and estimated mutation frequencies after normalizing for the number of biopsies tested.

