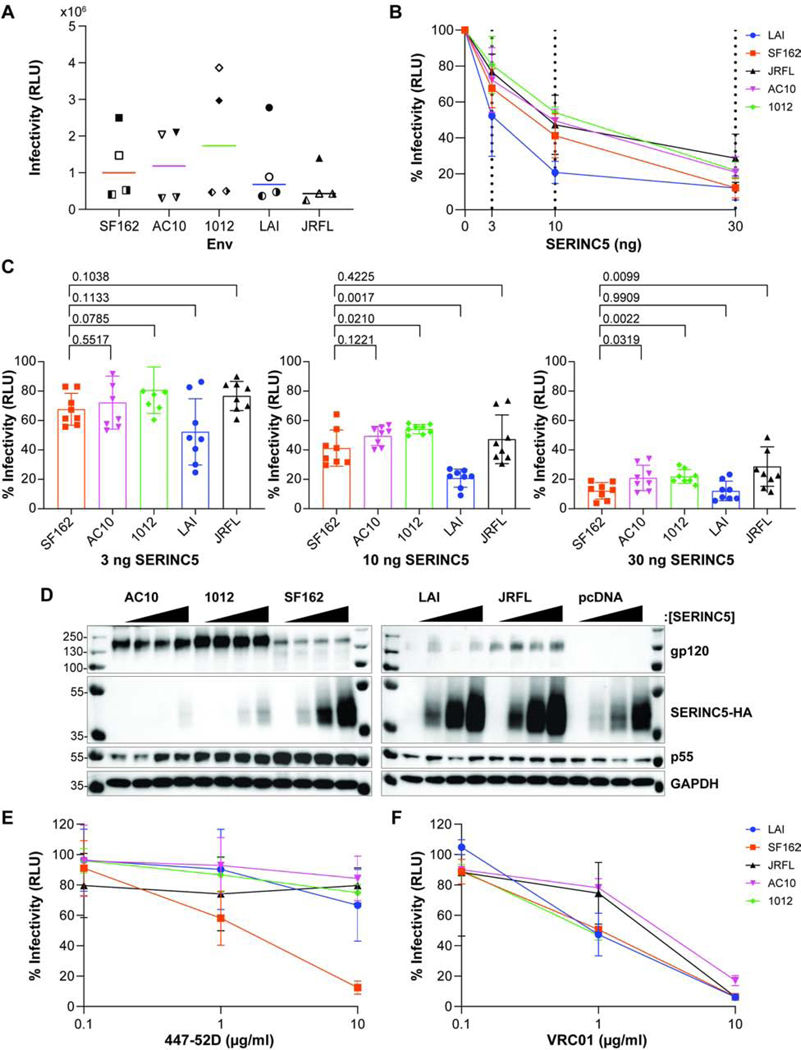
Figure 1. Relative sensitivity of different Envs to 447–52D antibody and SERINC5.

A) Pseudovirions comprising DHIV-ΔEnv-ΔNef and Env SF162, AC10, 1012, LAI or JRFL were produced in HEK 293T cells and infectivity measured by in HeLa TZM-bl luminescent reporter cells, as described in the Methods section. The relative light unit (RLU) values for four different preparations of pseudovirion stocks are shown for each Env; each preparation was measured in triplicate, and the mean of the four independent experiments is shown for each Env. Experiment 1 – filled symbol; 2 – the left half of symbol filled; 3 – the right half of symbol filled; 4 – symbol blank. B) SERINC5-mediated inhibition of infectivity. The relative infectivity of pseudovirions comprising indicated Envs is shown, following normalization to the no-SERINC5 plasmid control for each of the indicated Envs (0 ng SERINC5 = 100%). The dashed lines indicate the amount of SERINC5 plasmid used (0, 3, 10, or 30 ng). The data represents four independent experiments (pseudovirion preparations); each data point represents the mean of eight independent values for each Env (the infectivity of each pseudovirion preparation measured at 1:3 and 1:9 dilutions, each in triplicate). C) Relative infectivity of pseudovirions at increasing concentrations of SERINC5. Independent infectivity data values are compared for each concentration of SERINC5 for experiments presented in panel B. Pairwise comparisons between each Env to SF162 using Welch’s t-test (p values are shown). D) Expression of Env and SERINC5 in the HEK 293T virus producer cells. The HEK 293T producer cells were lysed and proteins separated by SDS-PAGE followed by immunoblotting for the indicated proteins. The Envs are indicated on top of panel D; each Env was grouped by increasing SERINC5 protein concentration: 0, 3, 10, then 30 ng from left to right; pcDNA is a no-Env control. E) Neutralization of infectivity by the antibody 447–52D. The relative infectivity of pseudovirions is shown on the y-axis after normalization to a no-antibody control for the indicated Envs (0 μg/ml 447–52D = 100%).10-fold increasing antibody concentrations from 0.10 μg/ml to 10 μg/ml were tested. The data shown represent two independent experiments; with each neutralization assay performed in duplicate. F) Neutralization of infectivity by the antibody VRC01. The relative infectivity of pseudovirions is shown on the y-axis after normalization to a no-antibody control for the indicated Envs (0 μg/ml VRC01 = 100%) 10-fold increasing antibody concentrations from 0.10 μg/ml to 10 μg/ml were tested. The data shown represent one experiment performed in duplicate.
