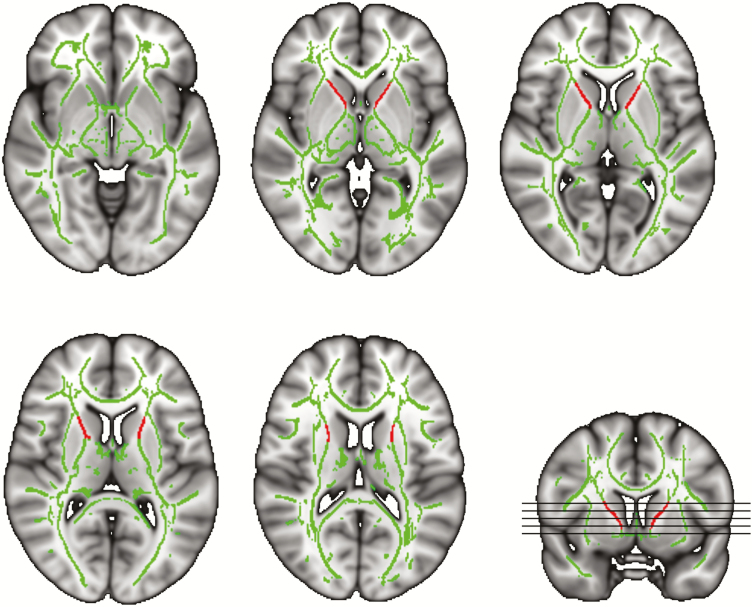
Figure 1.
Study-specific FA skeleton used for analysis. Green represents the mean FA skeleton across all participants. Red depicts the left and right mask of the anterior limb of the internal capsule which was used to calculate the mean FA value of the structure. Underlying gray-scale images are the Montreal Neurologic Institute 152-T1 1 mm template.

