
Figure 3.
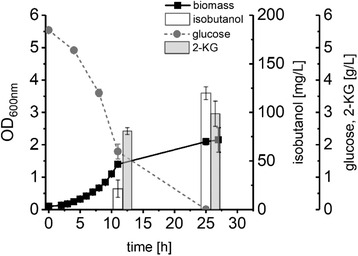
Growth (black circles), glucose consumption (grey circles), isobutanol production (white bars) and 2‐KG formation (grey bars) of P. putida Iso2 in DeBont minimal medium containing glucose. Experiments were performed in triplicates and error bars represent the corresponding standard deviation