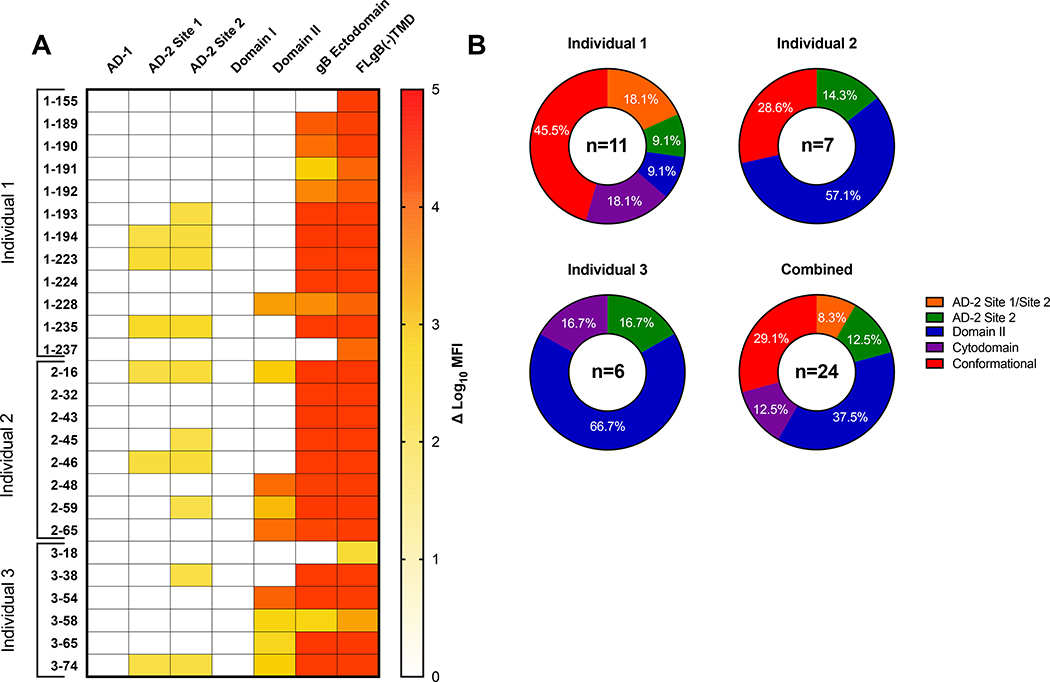
Figure 1. gB domain-specific mAb binding determined by BAMA.
(A) Heat map of gB domain-specific binding strength for 0gB-specific mAbs represented as log10 mean fluorescent intensity (MFI). (B) Pie charts representing the percentage of total gB-specific mAbs binding to each domain specificity assessed by BAMA per each naturally HCMV infected individual and all individuals combined. AD-2 Site 1/Site 2: Binding to both the AD-2 Site 1 and Site 2 peptide, AD-2 site 2: binding to the site 2 peptide only, Domain II: binding to Domain II only, Cytodomain: binding to full length gB, but not gB ectodomain, Conformational: binding to full length gB and gB ectodomain, but no other domain.

