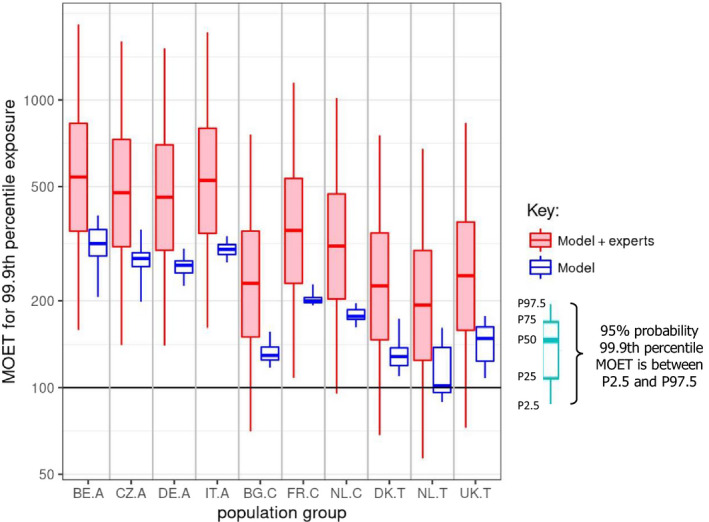
Figure 5.

CAG‐TCF: ‘Model’ boxplots show the unadjusted output of the MCRA Tier II model for the MOET at the 99.9th percentile of exposure in each consumer population in 2014–2016. ‘Model+experts’ boxplots show the result of combining the output of the Tier II model with the elicited distributions quantifying additional sources of uncertainty. Note that the vertical axis is plotted on a logarithmic scale; the values plotted for ‘model + experts’ are shown numerically in Table 7. A key to the populations and explanation of the boxplots are provided in the footnote below the graph.
- Key: Population groups: BE.A (Belgian adults), CZ.A (Czech Republic adults), DE.A (German adults), IT.A (Italian adults), BG.C (Bulgarian children), FR.C (French children), NL.C (Dutch children), DK.T (Danish toddlers), NL.T (Dutch toddlers), UK.T (United Kingdom toddlers). The lower and upper edges of each boxplot represent the quartiles (P25 and P75) of the uncertainty distribution for each estimate, the horizontal line in the middle of the box represents the median (P50) and the ‘whiskers’ above and below the box show the 95% probability interval (P2.5 and P97.5).
