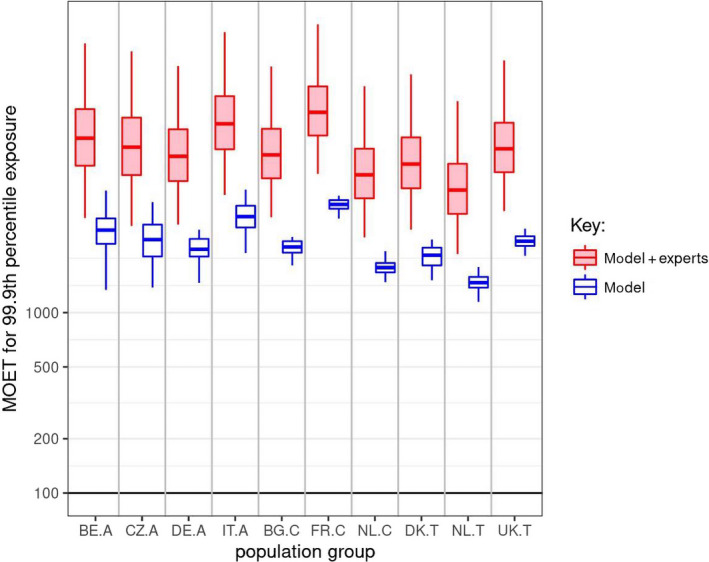
Figure 8.

CAG‐TCP: ‘Model’ boxplots show the unadjusted output of the MCRA Tier II model for the MOET at the 99.9th percentile of exposure in each consumer population in 2014–2016. ‘Model + experts’ boxplots show the result of combining the output of the Tier II model with the elicited distributions quantifying additional sources of uncertainty. Note that the vertical axis is plotted on a logarithmic scale; the values plotted for ‘model + experts’ are shown numerically in Table 10. A key to the populations and explanation of the boxplots are provided in the footnote below Figure 5
