Figure 3.

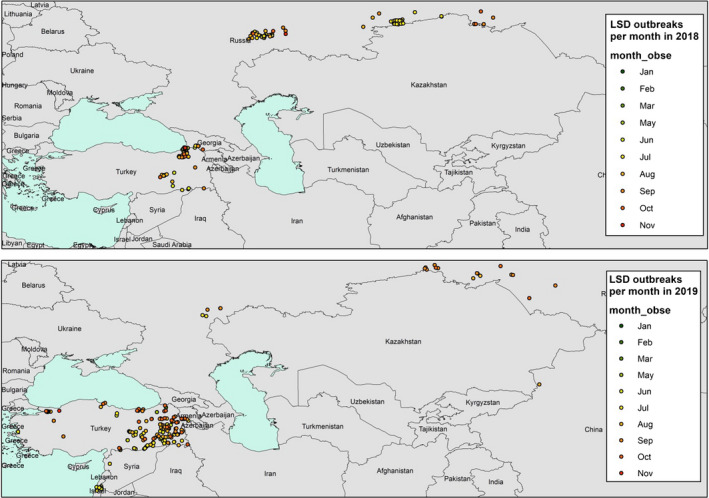
Monthly spatial distribution of the LSD outbreaks (coloured bubbles) in 2018 and 2019 (end of November). (Data source: Empres‐I and ADNS)

Monthly spatial distribution of the LSD outbreaks (coloured bubbles) in 2018 and 2019 (end of November). (Data source: Empres‐I and ADNS)