
Figure 12.
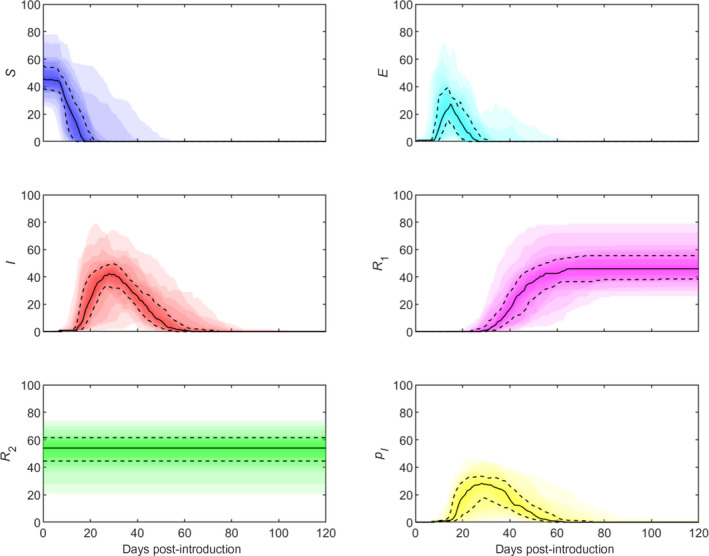
Simulated dynamics of lumpy skin disease virus in a cattle herd when transmission is by the bites of the stable fly, Stomoxys calcitrans
- Panels show the number of susceptible (S; blue), latent (E; cyan), infectious (I; red), recovered (R 1; magenta) and resistant (R 2; green) cattle and the proportion of infected vectors (p I; yellow) over time. Plots show the median (solid black line), 25th and 75th percentiles (dashed lines) and five percentile bands (up to the 5th and 95th percentiles; shading). Simulations assume a herd size of 100 cattle and infection is initiated by a single infected vector. Results are based on 1000 replicates of the model; only results for those replicates in which there was an outbreak (i.e. there was at least one infected bovine) are shown. The proportion of replicates resulting in an outbreak was 4.8%.