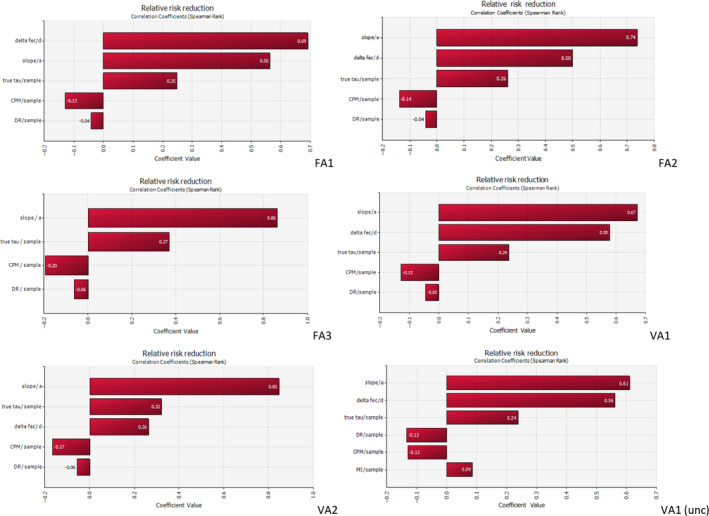
Figure C.2.

Tornado graphs showing the correlation of the uncertainty in the input distributions with the uncertainty in the relative risk reductions for the three feed additives (FA1, FA2 and FA3), the two vaccines (VA1 and VA2) and VA1 with additional uncertainty. A larger correlation coefficient indicates that the uncertainty in the input parameter has a larger impact on the uncertainty in the relative risk reductions found (and illustrated in Figure A
