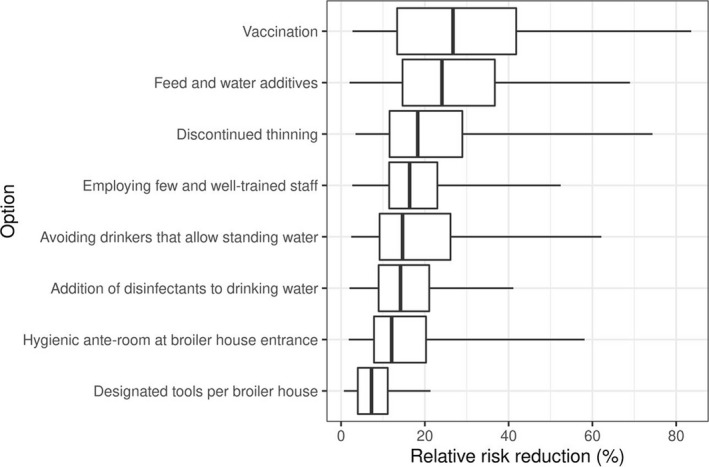
Figure D.2.

Boxplots comparing the initial unweighted linear pool distributions for all eight control options considered in step 2, prior to the consensus process. For each control option, the horizontal line represents the 95% probability interval of the linear pool distribution, the box represents the interquartile range (covering 50% probability) and the vertical bar within the box is the median
