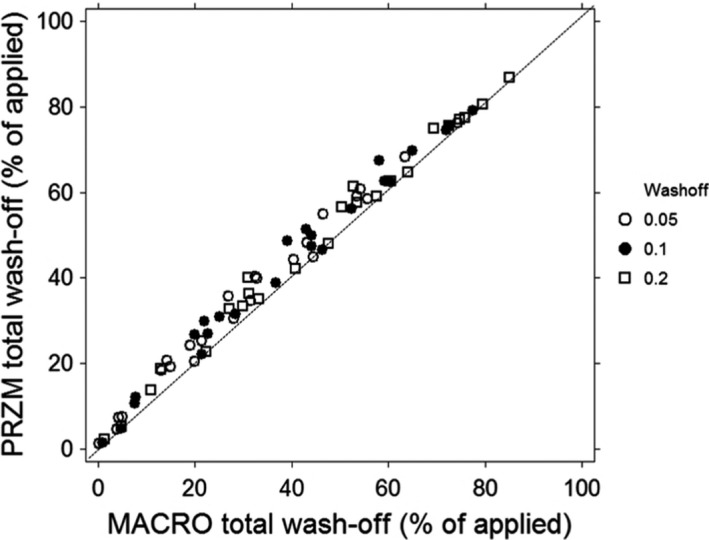
Figure F.3.

Comparison of wash‐off simulated by PRZM and MACRO (application at midnight) illustrating the effects of the wash‐off coefficient (0.05, 0.1 and 0.2 mm−1)
- Note that the simulation results for the two rainy application days have been excluded for the sake of clarity.
