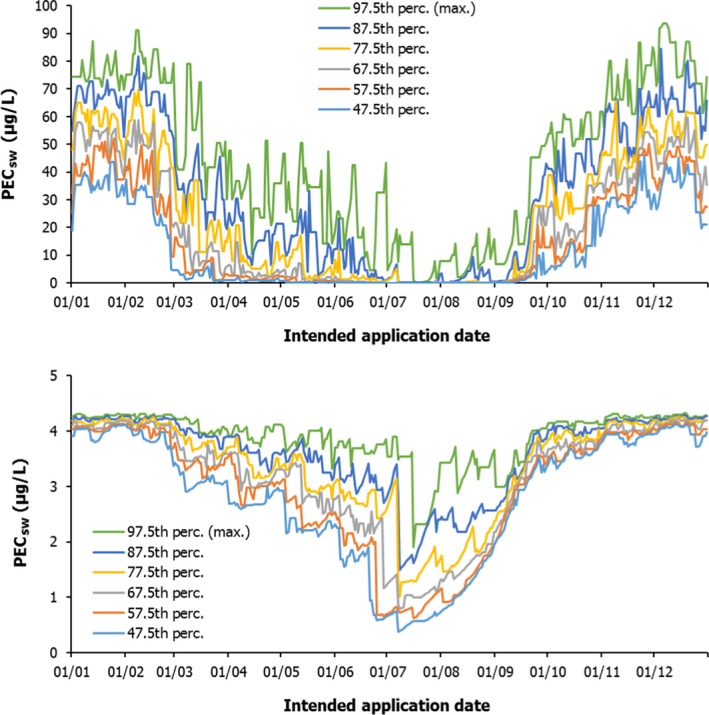
Figure I.8.

PEC sw (μg/L) for dummy substance A (top) and dummy substance F (bottom) in the run‐off scenario R2 (stream) at different temporal percentiles (47.5th to the 97.5th) in relation to the intended application date (1 × 1 kg/ha, potatoes, application to soil surface, run‐off only, no drift, 7‐day application window, TOXSWA stream meta model)
