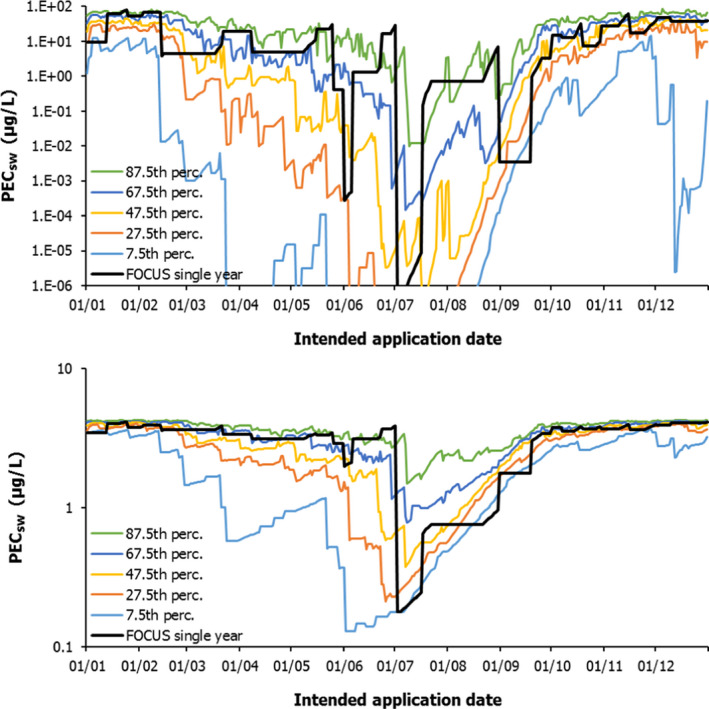
Figure I.10.

PEC sw (μg/L) for dummy substance A (top) and dummy substance F (bottom) in the run‐off scenario R2 based on the new 20‐year assessment approach (7.5th to the 87.5th percentile, 7‐day application window) and the current FOCUS single‐year assessment approach, in relation to the intended application date (potatoes, 1 × 1 kg/ha to the soil surface, no drift). Data are based on a TOXSWA stream meta model
