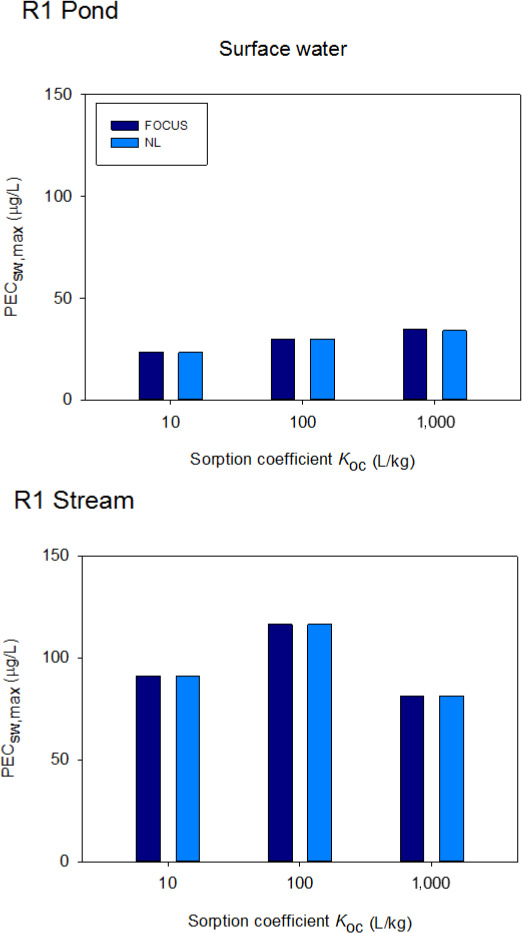
Figure N.2.

Selected 92.5th percentile values of the 20 annual maximum PEC sw values as a function of the Koc of the simulated compounds for the R1 pond (top) and R1 stream (bottom) having the FOCUS sediment or the selected Dutch sediment (with a higher organic matter content) in the repaired FOCUS scenarios
