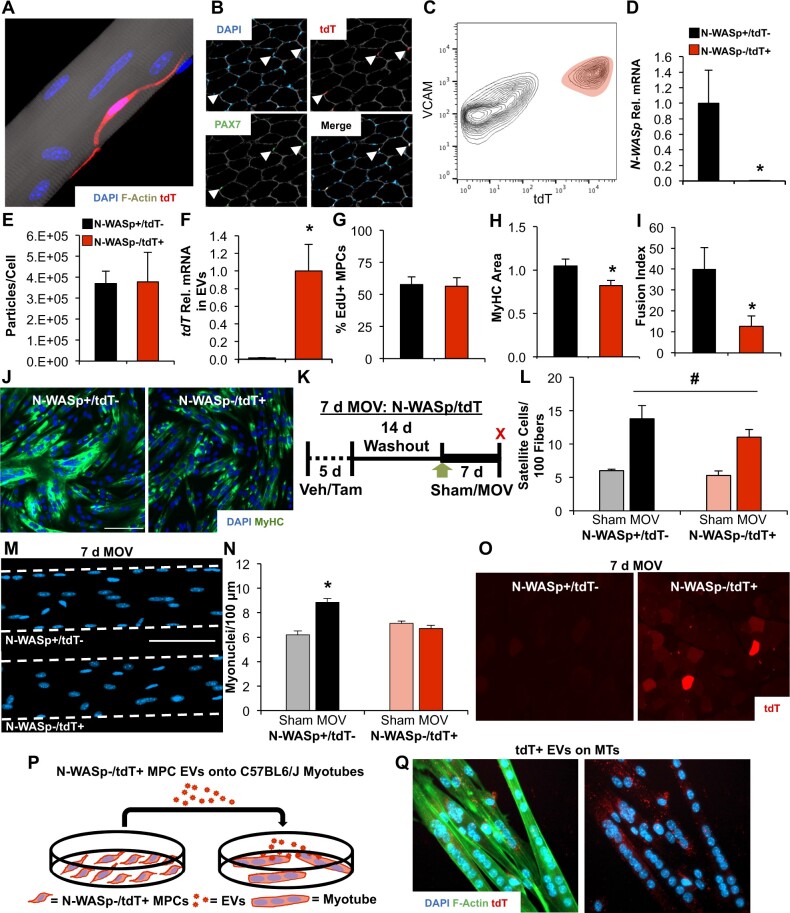
Figure 1.
Delayed satellite cell fusion and EV-dependent communication to muscle fibers during 7 days of MOV. (A) Confocal image of a tdT-expressing satellite cell (red) overlaid with DAPI (blue) on a muscle fiber (stained for F-actin, gray), illustrating Pax7Cre-mediated recombination of the floxed tdT transgene in the presence of tamoxifen. (B) Histochemical image depicting Pax7 immunostaining (green) that coincided with tdT fluorescence (red) in the correct anatomical location (beneath laminin, gray, and overlaid with DAPI, blue) after tamoxifen treatment. (C) Flow cytometry plot illustrating tdT+ cells coexpressing Vcam, which was used to identify and purify satellite cells via FACS in tamoxifen-treated mice; Vcam+/Cd31−/Cd45−/Sca1− cells were purified in vehicle-treated mice, as described previously,33 and tdT recombination was minimal (not shown). (D) Gene expression to confirm N-WASp recombination from in vivo-treated vehicle (N-WASp+/tdT−) versus tamoxifen-treated (N-WASp−/tdT+) primary MPCs purified via FACS, n = 2 biological replicates per condition. (E) Nanoparticle tracking analysis showing EV particle abundance normalized to cell count from N-WASp+/tdT− and N-WASp−/tdT+ MPCs, n = 2 biological replicates per condition. (F) Relative tdT mRNA abundance in EVs isolated from N-WASp+/tdT− (n = 2 biological replicates) and N-WASp−/tdT+ MPCs (n = 3 biological replicates). (G) Proliferation in N-WASp−/tdT+ and N-WASp+/tdT− MPCs (n = 3 biological replicates per condition). (H) MyHC area after 30 h of differentiation (n = 3 biological replicates per condition). (I) Fusion index (n = 3 biological replicates per condition). (J) Representative images of MPC fusion in N-WASp+/tdT− versus N-WASp−/tdT+ conditions; green is MyHC and blue is DAPI. (K) Study design schematic illustrating vehicle (Veh) and tamoxifen (Tam) treatment followed by sham or 7 days of MOV in N-WASp/tdT mice. (L) Satellite cells normalized to muscle fiber count in N-WASp+/tdT− (n = 5 sham and 5 MOV) versus N-WASp−/tdT+ (n = 6 sham and 7 MOV) mice. (M) Representative images of myonuclei in isolated single muscle fibers from MOV mice. (N) Myonuclear content analysis on isolated single muscle fibers. (O) Representative image of tdT fluorescence in MOV N-WASp−/tdT+ muscle fibers despite the prevention of satellite cell-mediated myonuclear accretion. (P) Study design schematic illustrating the treatment of wild type C57BL/6J myotubes with EVs from N-WASp−/tdT+ MPCs. (Q) Representative image showing tdT puncta (red) in C57BL/6J myotubes (stained for F-actin, green, and DAPI, blue) incubated with N-WASp−/tdT+ MPC EVs. *P < 0.05, #P < 0.05 effect of MOV, scale bars = 100 µm, all data are presented as mean ± SE.

