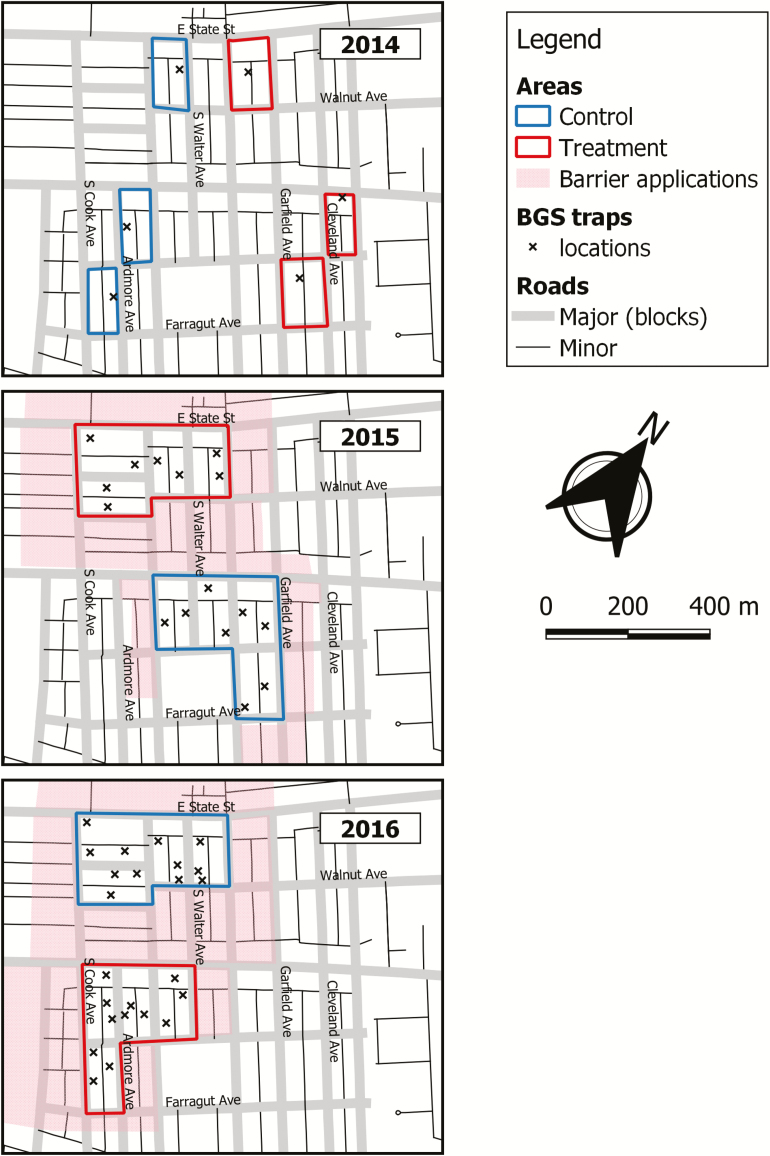
Fig. 1.
Map of the study area with treatment and reference blocks. BGS traps per block (2014: n = 1, 2015: n = 2, 2016: n = 3, where n is number of traps per each site), autodissemination stations, and oviposition cup locations are shown. Barrier treatments were conducted around treatment and reference blocks inside and outside of the study area.

