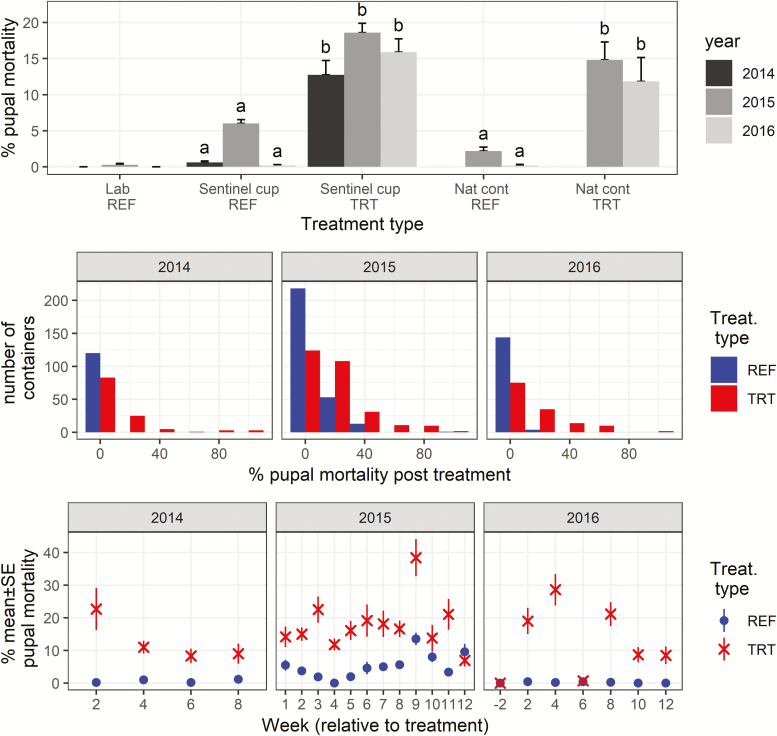
Fig. 4.
Pupal mortality in bioassay experiments. The upper panel summarizes data over the study period (mean and SE) for laboratory reference samples (Lab REF), containers deployed in the field (Sentinel cups), and naturally occurring containers (Nat cont, 2015–2016 only) in both the reference (REF) and autodissemination treatment blocks (TRT). Different letters indicate statistical significance at P < 0.001 between categories within each year. The middle panel shows the distribution of mortalities in containers deployed in reference (REF) and treatment (TRT) sites. The data were aggregated at 20% intervals from 0 to 100%. For both treatment types, sentinel cups and naturally occurring containers were combined. The lower panel shows average percent pupal mortality with standard error by week following autodissemination station deployment at week = 0. In 2015–2016, Field and Container categories were combined for reference and treatment blocks. In 2016, the pupal mortality was also measured 2 wk prior to the deployment, i.e., week = −2.

