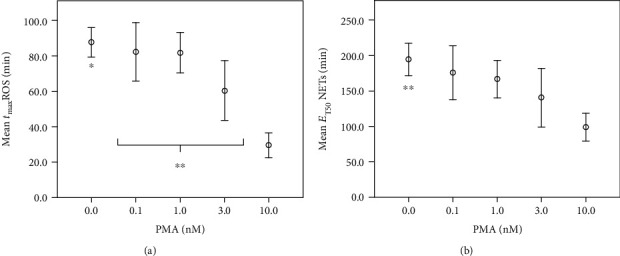
Figure 3.

Point of time of ROS production and half-maximal NET formation decrease during PMA exposition. x-axis: PMA (nM) concentration in nM; y-axis: (a) mean time of maximal ROS formation tmaxROS (min) in min; (b) mean time of half-maximal NET formation ET50NETs in minutes; ∗significant compared to 3 nM and 10 nM PMA; ∗∗significant (P < 0.05) compared to 10 nM PMA; error bars represent standard deviation of measurements.
