
Figure 4.
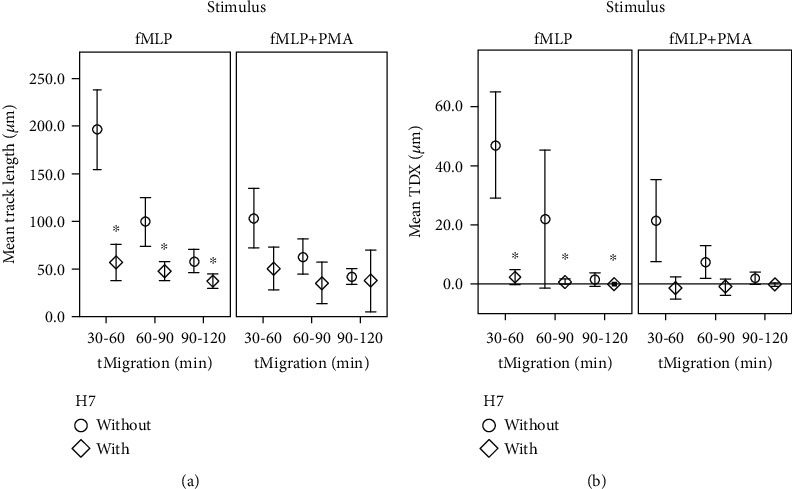
Chemotaxis decreases during H7 exposition. x-axis: 30-minute time intervals tMigration (min), y-axis: (a) mean track length in μm; (b) mean track displacement along the x-axis TDX in μm; comparing groups with and without H7; ∗significant (P < 0.05) compared to the control group without H7; error bars represent standard deviation of measurements.