
Figure 6.
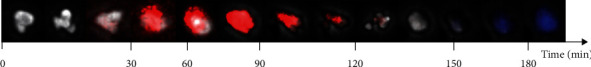
Live cell imaging: time flow in min of a PMN treated with fMLP and H7 showing chemotaxis (phase-contrast), oxidative activity (red, rhodamine-123, staining reactive oxygen species (ROS)), and suicidal NETosis (blue, DAPI, staining PMN–DNA (NET)).