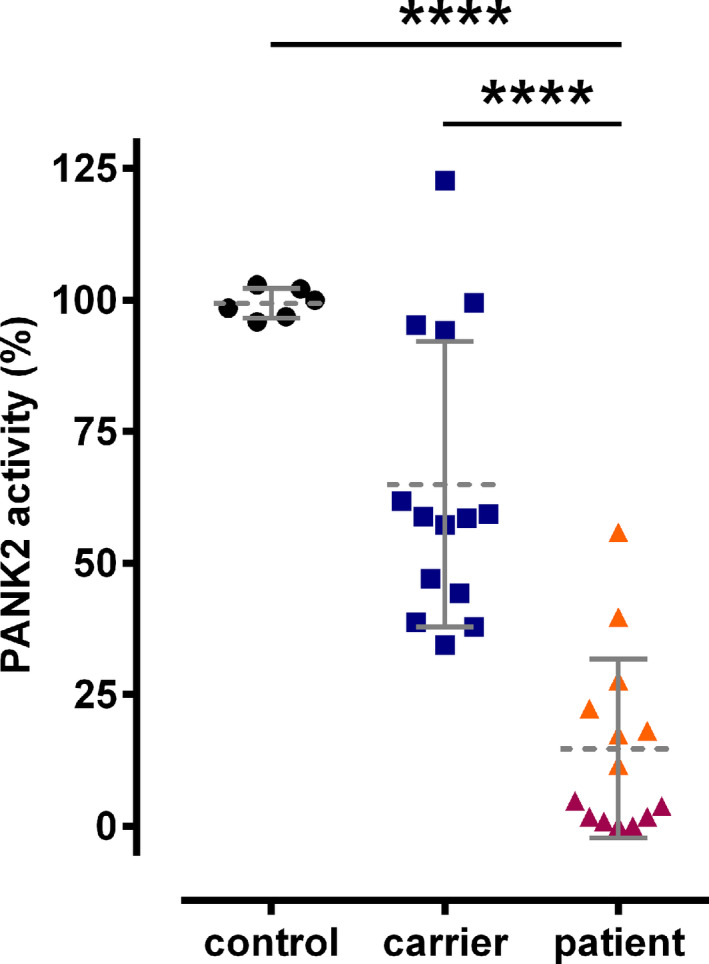
Figure 3.

Comparison of erythrocyte PANK2 activity between control donors, carriers, and patients. Erythrocyte PANK2 activities are plotted for control donors (black circles), carriers (blue squares), and patients (orange and red triangles with or without at least one allele harboring a T528M or R278L, respectively). For numerical data, compare to Table 2. Statistical analyses (unpaired student’s t‐test) revealed the significance of the difference between the mean values of the groups (**** <0.001) as indicated.
