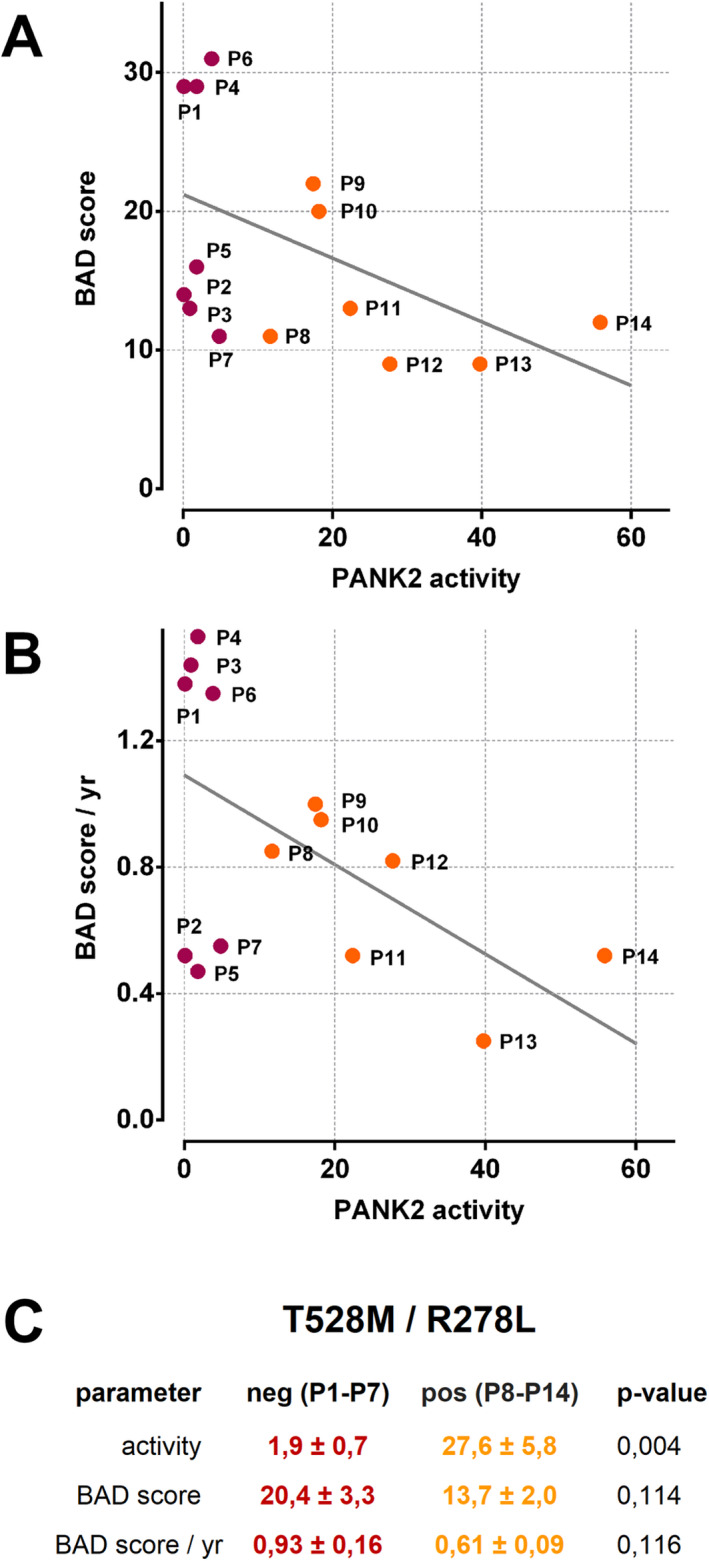
Figure 6.

Negative correlation between residual erythrocyte PANK2 activity in patients and their score of neurodegeneration. Residual erythrocyte PANK2 activity is plotted against the BAD score (A) or an age‐normalized version thereof (B). Data points are identified by the patient IDs and either designated by orange circles (patients with at least one allele harboring a T528M or R278L mutation) or dark red circles (patients without T528M or 278L mutation), respectively. (C) Patients were grouped whether or not they have at least one allele of the c.1583C > T or c.833G > T mutation in their PANK2 gene (T528M/R278L positive or negative). Mean values and standard error (SE) of the indicated parameters within these subgroups are given in percent of control (activity see also Table 2) or absolute numbers (BAD score and BAD score / yr, see also Table 1). An unpaired student’s t‐test was applied to assess the significance (P‐value) of the difference between respective means.
