
Figure 3.
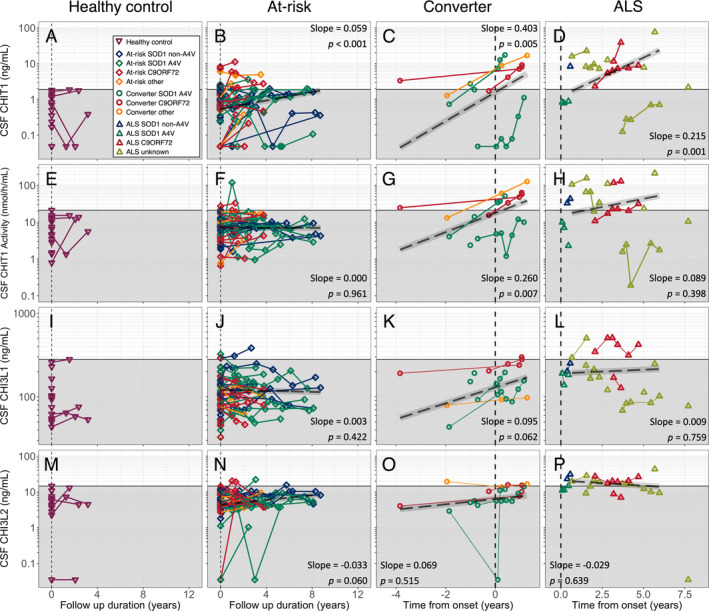
(A–D) CHIT1 concentration, (E–H) CHIT1 activity, (I–L) CHI3L1 concentration, (M–P) CHI3L2 concentrations; (A, E, I, M) healthy controls; (B, F, J, N) presymptomatic at‐risk individuals; (C, G, K, O) participants developing ALS during follow‐up and (D, H, L, P) participants with symptoms of ALS at enrolment. Grey box indicates highest level of each analyte (or activity) detected in control samples. Dashed black line with grey ribbon indicates the estimated trajectory of chitinase protein levels in asymptomatic carriers (B, E, H, L) or converters and ALS patients (C, F, I, L), with slope and P‐value obtained from the linear mixed effect model and protein level calculated using the median baseline age in that group. Vertical dashed line indicates first sampling (healthy control and at‐risk individuals), or date of onset of clinically manifest disease (phenoconverter and ALS groups). CSF, cerebrospinal fluid; CHIT1, Chitotriosidase 1; CHI3L1, Chitinase 3‐like protein 1; CHI3L2, Chitinase 3‐like protein 2; At‐risk, presymptomatic gene carrier; ALS, amyotrophic lateral sclerosis; Converter, participants asymptomatic at enrolment developing clinically manifest disease during follow‐up; C9ORF72, C9ORF72 hexanucleotide repeat expansion carrier; A4V, SOD1 A4V mutation carrier; Non‐A4V, SOD non‐A4V mutation carrier; None, no mutation; Other, carrier of other highly penetrant ALS‐causing gene mutation; Unknown, no mutation identified.