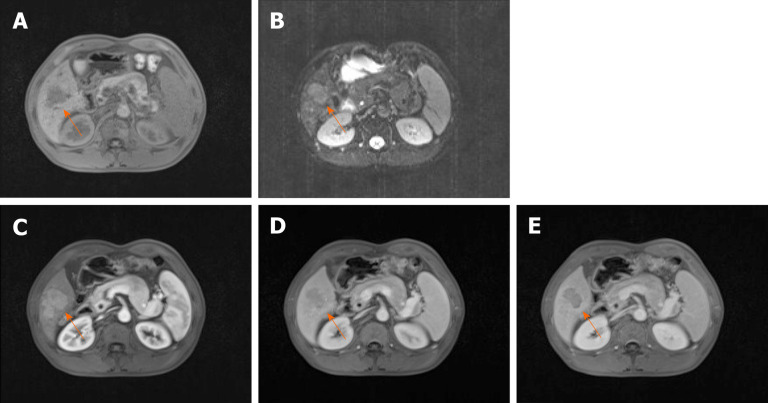
Figure 2.
Preoperative magnetic resonance imaging plain and enhanced scans of the upper abdomen. The location of liver tumor in each figure was marked by the arrow. A: T1-weighted image; B: T2-weighted image; C: Enhanced scan of hepatic arterial phase; D: Enhanced scan of hepatic portal vein phase; E: Enhanced scan of hepatic parenchymal phase.

