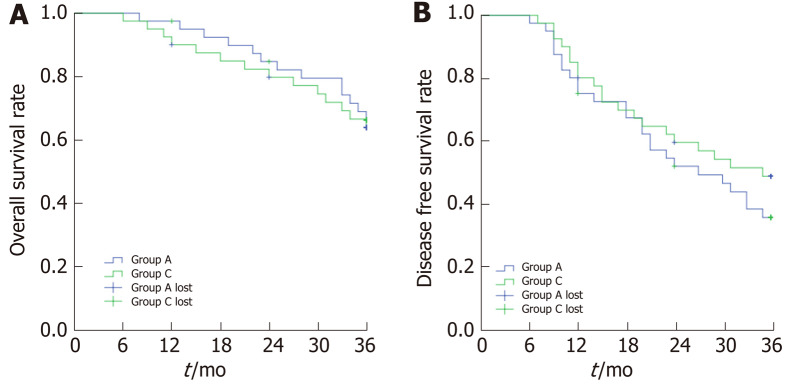
Figure 6.
Kaplan-Meier survival analysis of overall survival and disease-free survival of Group A and Group C. A: Overall survival rate analysis. The difference of Group A and Group C was not statistically significant (Log Rank = 0.121, P = 0.728); B: Disease-free survival rate analysis. The difference of Group A and Group C was not statistically significant (Log Rank = 1.042, P = 0.307).

