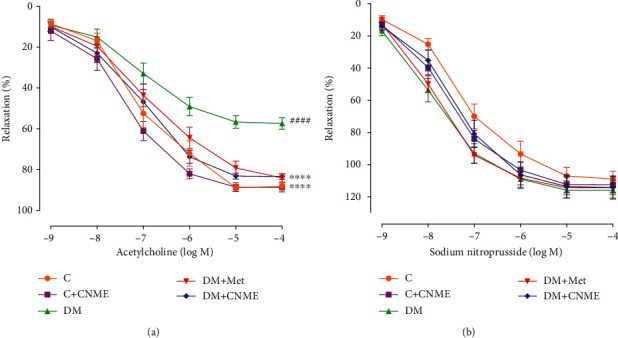
Figure 2.

Endothelium-dependent and endothelium-independent relaxations in the thoracic aorta of rats: (a) concentration response curves to ACh (10−9 -10−4 M); (b) concentration response curves to SNP (10−9 -10−4 M). Data are presented as mean ± SEM (n = 12). Relaxations were expressed as a percentage of the contraction induced by PE (10−6 M). ####P < 0.0001 vs. C. ∗∗∗∗P < 0.0001 vs. DM.
