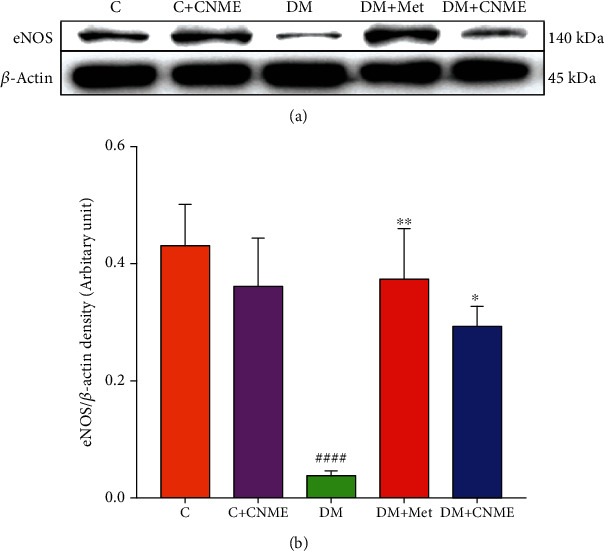
Figure 4.

Western blot analysis of eNOS protein expression in the thoracic aorta: (a) representative Western blots showing the expression of eNOS protein of C, C+CNME, DM, DM+Met, and DM+CNME groups; (b) graphical representation of the data, normalized to β-actin. Data are presented as mean ± SEM (n = 12). ####P < 0.0001 vs. C. ∗P < 0.05 and ∗∗P < 0.01 vs. DM.
