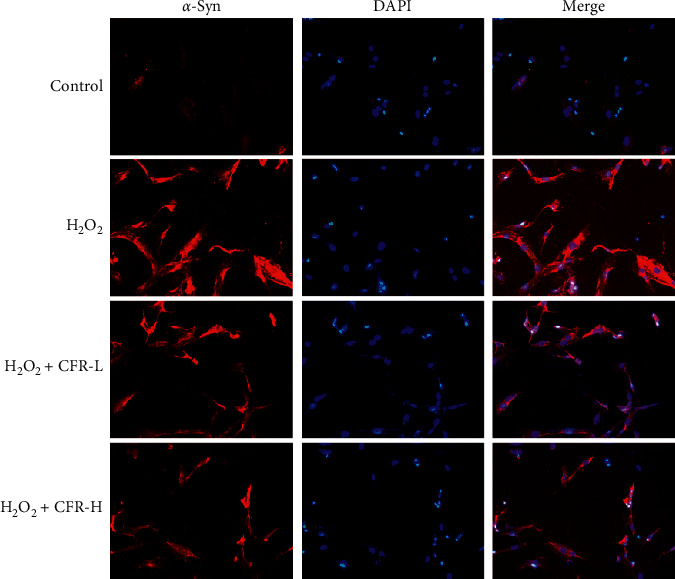
Figure 6.

Expression of α-syn in SK-N-SH cells after the CFR treatment (magnification, ×200). Control group: transfected with empty control plasmids, H2O2 group: transfected with α-syn plasmids and 300 μM H2O2, H2O2 + CFR-L group: transfected with α-syn plasmids, 300 μM H2O2, and 5% CFR, and H2O2 + CFR-H group: transfected with α-syn plasmids, 300 μM H2O2, and 10% CFR.
