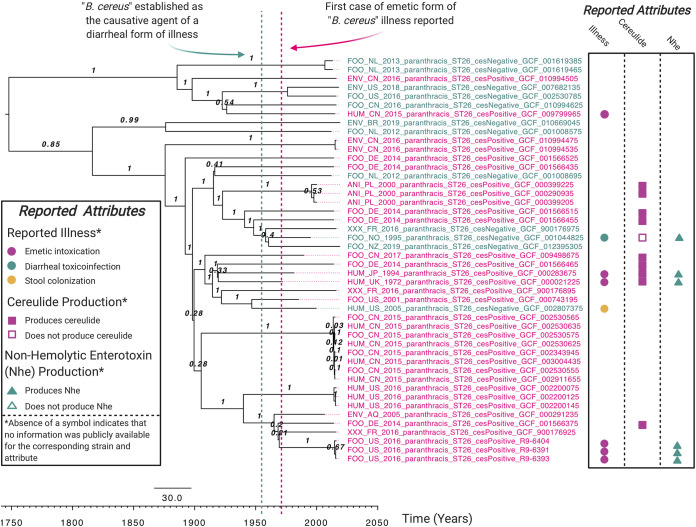
FIG 3.
Rooted, time-scaled maximum clade credibility (MCC) phylogeny constructed using core SNPs identified among 46 group III B. cereus sensu lato genomes assigned to sequence type (ST) 26. Isolation years for strains ranged from 1972 to 2019 (Table S3). Tip label colors denote ces-positive (pink) and ces-negative (teal) genomes predicted to be capable and incapable, respectively, of producing cereulide. Tip labels of isolates that could be associated with one or more of the following attributes using publicly available metadata are annotated on the right side with symbols displayed in the “Reported Attributes” legend: (i) a known B. cereus sensu lato illness (emetic intoxication, diarrheal toxicoinfection, or stool colonization), (ii) cereulide-producing phenotype (reported to produce cereulide or not; note that strains could not merely possess or lack ces genes, but had to be reported as cereulide-producing or not cereulide-producing using phenotypic methods), and/or (iii) nonhemolytic enterotoxin (Nhe)-producing phenotype (reported to produce Nhe or not; note that strains could not merely possess or lack nhe genes, but had to be reported as Nhe-producing or not Nhe-producing using phenotypic methods). The absence of a symbol indicates that no information was publicly available for the corresponding strain and attribute (e.g., additional isolates were associated with illness; however, these are not annotated, since the type of illness could not be confirmed from the available literature). Branch labels denote posterior probabilities of branch support. Time in years is plotted along the x axis, with branch lengths reported in years. Core SNPs were identified using Snippy v4.3.6. The phylogeny was constructed using the results of five independent runs using a relaxed lognormal clock model, the Standard_TVMef nucleotide substitution model, and the Coalescent Bayesian Skyline population model implemented in BEAST v2.5.1, with 10% burn-in applied to each run. LogCombiner-2 was used to combine BEAST 2 log files, and TreeAnnotator-2 was used to construct the phylogeny using median node heights. The figure was annotated using BioRender. See Fig. S3 (https://doi.org/10.6084/m9.figshare.c.5057276.v1) to view node height 95% highest posterior density (HPD) intervals.

