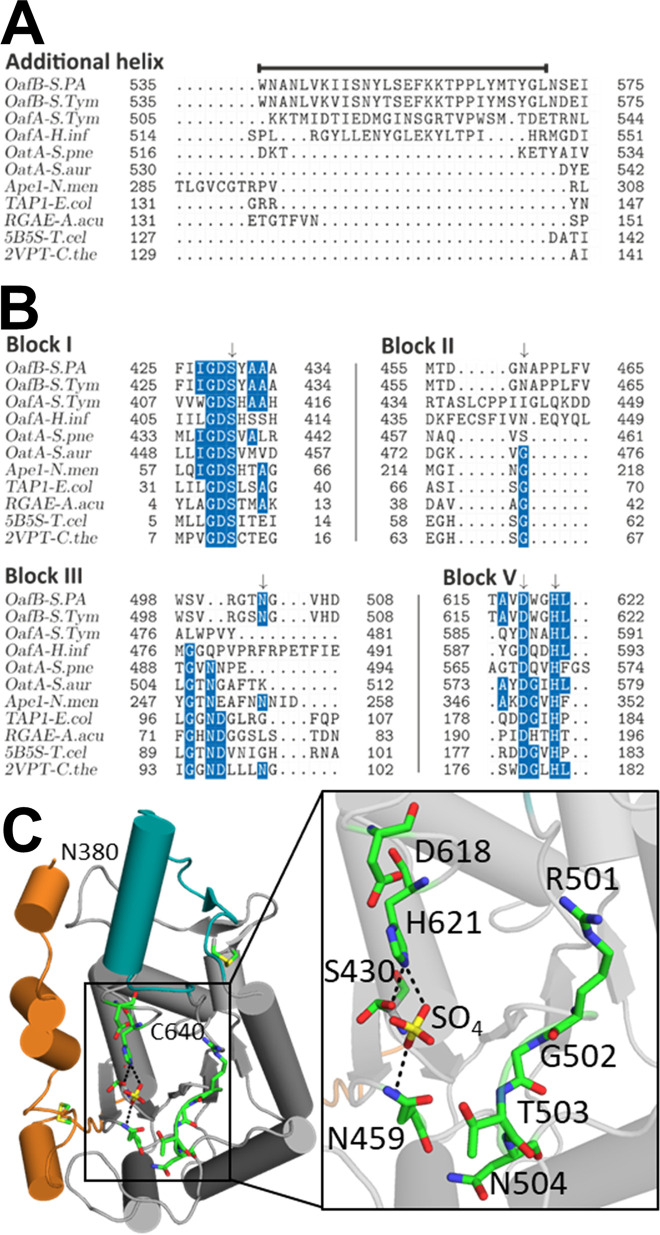
FIG 6.
Analysis of additional helix and catalytic triad residues (A and B) Structure-based sequence alignments of additional helix (A), indicated by a line above the sequence, and blocks I to V (B) with residues conserved in >50% of sequences highlighted blue; catalytic and oxyanion hole residues are indicated by an arrow. Abbreviations and details of sequences used are in Materials and Methods. (C) Catalytic triad and potential oxyanion hole residues are shown as sticks; hydrogen bonds to cocrystallized sulfate ion are shown as dotted black lines.

